Methodology
Campus Skills Report
Skills Graph
The Coursera Skills Graph maps the connections among skills, learning content, careers, and learners on Coursera’s platform.
In the graph, we present connections among skills, together with a skills taxonomy, where higher-level skills are parents of more granular skills. We also map skills to both courses on Coursera and the graded items that assess the skills. Finally, we connect skills to learners who demonstrate their proficiency by passing relevant graded items.

Skills Taxonomy
The skills in the Coursera Skills Taxonomy are mapped to courses using a machine learning model trained on a data set of university instructor, subject-matter expert, and learner labels of skill-to-course tags. For each skill-course pair, the machine learning model outputs a score that captures how likely it is that the skill is taught in that course.
When a skill is tagged to a course, we extract graded items which assess that skill in order to create skill-to-assessment mappings. This final set serves as the pool we use to measure individual learners’ skill proficiencies.

Benchmarking
To benchmark skill proficiency for groups of learners, we first benchmark the skill proficiency of each learner in each skill. Once we’ve identified what skills each assessment is testing, we use learner assessment data to train machine learning models that estimate both how proficient a learner is in a skill and how challenging an assessment is. Then, we aggregate the learner proficiencies to compute the proficiency gaps between students and their career objectives.

Skill-to-Job Pathways
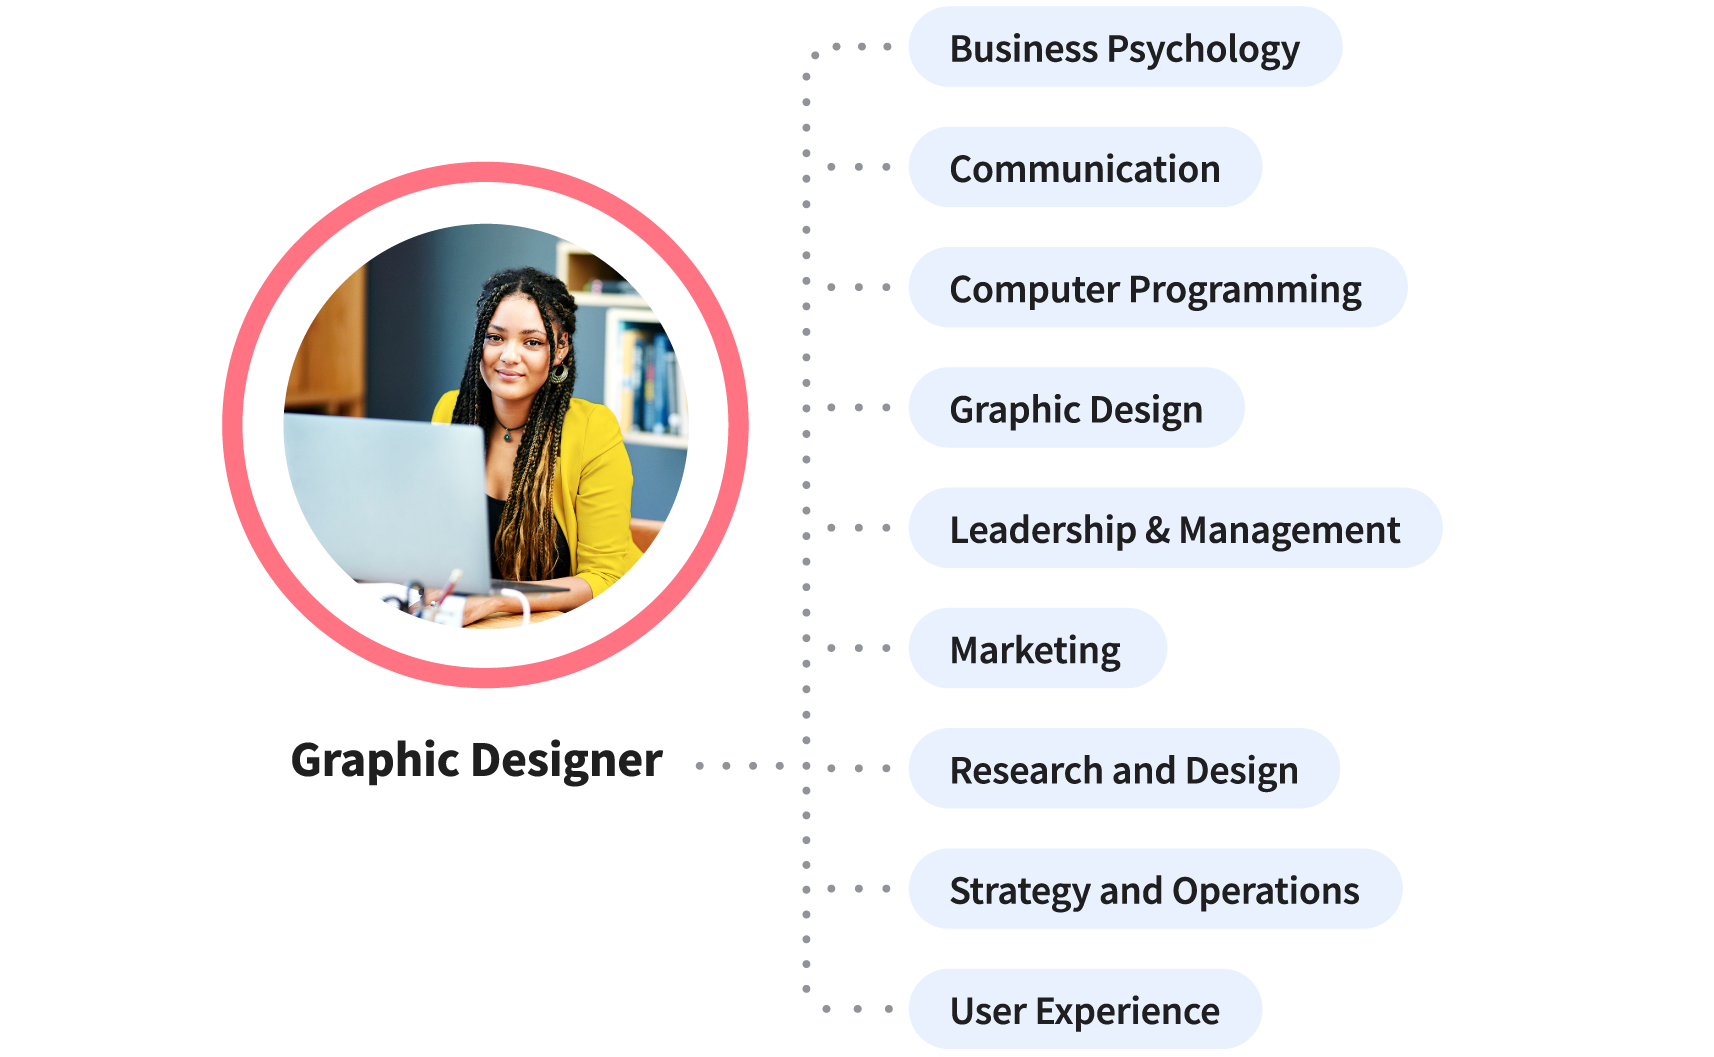
The Campus Skills Report uses skill-to-job pathways as an analytic tool to understand the skills learners are acquiring by major to become job-ready. First, we select learners by their academic discipline and further categorize them by their career objectives. Then, for each learner, we compute the share of assessment attempts made in each skill learned.
These data sets are reflected in Sankey diagrams showing pathways from skills on Coursera to learners’ career goals. Thicker lines from skills to jobs indicate there are more learners taking assessments based on those skills with the intent of moving into those jobs.
Over-Indexing Skills
To determine which skills learners are most interested in within a particular industry, we identify which skills are disproportionately popular within a particular group of learners. We restrict to skills with greater than 1,000 enrollments to ensure over-indexing skills are sufficiently popular, and refer to the Coursera Skills Graph to determine whether a course teaches a specific skill.