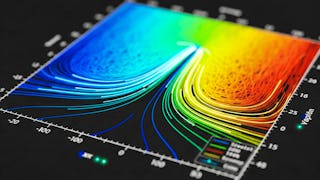
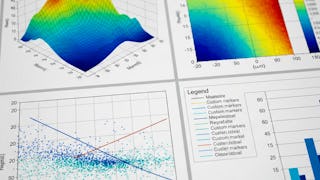
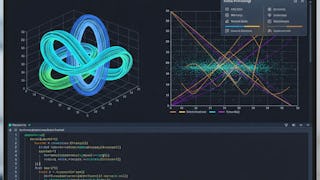
This advanced-level course equips learners with the skills to design, customize, and interpret complex data visualizations using Matplotlib. Through a structured progression from foundational customization techniques to specialized plotting methods, learners will explore paths, transformations, colors, colormaps, text rendering, annotations, axes customization, and 3D visualization.


Advanced Data Visualization with Matplotlib Mastery
This course is part of Matplotlib: Python Data Visualization & Wrangling Specialization

Instructor: EDUCBA
Access provided by RCC Institute of Information Technology
What you'll learn
Apply paths, transformations, and axes customization for precise control.
Use advanced colormaps, scaling, and annotations to enhance clarity.
Build 3D and specialized plots to communicate complex, multi-dimensional data.
Skills you'll gain
Details to know

Add to your LinkedIn profile
12 assignments
September 2025
See how employees at top companies are mastering in-demand skills

Build your subject-matter expertise
- Learn new concepts from industry experts
- Gain a foundational understanding of a subject or tool
- Develop job-relevant skills with hands-on projects
- Earn a shareable career certificate

There are 4 modules in this course
This module guides learners through advanced concepts in Matplotlib, focusing on creating and manipulating paths, applying visual effects, and mastering the transformation framework for precise control over plot elements. Learners will explore complex path structures, use path effects for enhanced visual styling, and work with various coordinate systems—including blended transformations—for dynamic and context-aware positioning in data visualizations.
What's included
7 videos3 assignments1 plugin
This module explores advanced customization and application of colors in Matplotlib visualizations. Learners will master techniques for defining custom colors, creating and modifying colorbars, designing colormaps for specific datasets, and applying various normalization and scaling methods to enhance data interpretation. Special attention is given to selecting colormaps that align with data characteristics and ensuring perceptual accuracy through lightness analysis.
What's included
11 videos3 assignments
This module focuses on enhancing Matplotlib visualizations with advanced text formatting, legends, annotations, and creative connection styles. Learners will explore methods to position and style text, apply annotations in both Cartesian and polar coordinates, use advanced connection patches, and create dynamic effects such as zoom indicators between plots. Through these techniques, learners will be able to add clarity, context, and visual appeal to their data presentations.
What's included
12 videos3 assignments
This module explores Matplotlib’s advanced axes customization and specialized plotting capabilities. Learners will master the Axes Artist toolkit for creating floating axes, parasite axes, and anchored artists, while also integrating LaTeX rendering, custom grid layouts, and multi-page PDF exports. The module further extends into 3D plotting, where learners will create and customize three-dimensional lines, bars, and coordinate systems to visualize complex datasets with clarity and precision.
What's included
14 videos3 assignments
Earn a career certificate
Add this credential to your LinkedIn profile, resume, or CV. Share it on social media and in your performance review.
Why people choose Coursera for their career


