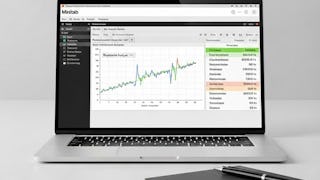
By completing this course, learners will be able to apply predictive modeling, perform hypothesis testing, analyze correlations, and build regression models to interpret complex datasets. They will gain skills in statistical tools such as ANOVA, chi-square, t-tests, and control charts while learning to implement and interpret outputs using Minitab and Excel.


Predictive Analytics: Apply, Analyze & Interpret
This course is part of Predictive Analytics & Modeling with Minitab Specialization

Instructor: EDUCBA
Access provided by Securities and Futures Commission
What you'll learn
Apply predictive modeling and hypothesis testing using Minitab and Excel.
Analyze data with ANOVA, chi-square, and regression techniques.
Interpret statistical outputs to make real-world business decisions.
Skills you'll gain
Details to know

Add to your LinkedIn profile
18 assignments
October 2025
See how employees at top companies are mastering in-demand skills

Build your subject-matter expertise
- Learn new concepts from industry experts
- Gain a foundational understanding of a subject or tool
- Develop job-relevant skills with hands-on projects
- Earn a shareable career certificate

There are 5 modules in this course
This module introduces the foundations of predictive analytics, covering the basics of predictive modeling and essential statistical tools. Learners will explore regression approaches, ANOVA, and control charts while gaining practical exposure to Minitab for data analysis and interpretation.
What's included
5 videos3 assignments
This module emphasizes the importance of observations in analytics. Learners will examine NAV prices, descriptive statistics, and case-based insights such as customer complaints, health data, and loan applicant results to build real-world analytical perspectives.
What's included
8 videos3 assignments
This module focuses on hypothesis testing with practical applications of t-tests, ANOVA, and chi-square tests. Learners will understand when to apply different tests and how to interpret results for business and research contexts.
What's included
7 videos3 assignments
This module explores correlation concepts, implementation, and interpretation. Learners will study correlation basics, use Minitab for analysis, and apply correlation results to financial and real-world datasets for better decision-making.
What's included
10 videos4 assignments
This module provides a comprehensive study of regression, including basic principles, scatterplots, equations, applications, and advanced insights. Learners will analyze demographic, financial, and scientific datasets to master regression modeling and interpretation.
What's included
25 videos5 assignments
Earn a career certificate
Add this credential to your LinkedIn profile, resume, or CV. Share it on social media and in your performance review.
Why people choose Coursera for their career


Explore more from Data Science

O.P. Jindal Global University

University of Colorado Boulder


