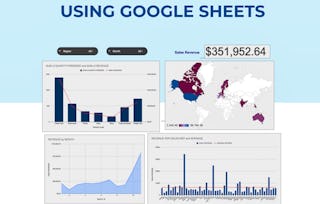
This is a self-paced lab that takes place in the Google Cloud console. Learn to create pie charts, column charts, combo charts and scatter charts in Google Sheets. You also create sparklines and progress bars and learn how to share your spreadsheet in Google Slides and over the web.
Use Charts in Google Sheets
Use Charts in Google Sheets
Instructor: Google Cloud Training
Access provided by Workforce Innovation Network (WIN) LLC
Build in-demand job skills with step-by-step instructions
Advanced level
Recommended experience
30 minutes
Learn at your own pace
Hands-on learning
What you'll learn
Visualize datasets using pie charts, column charts, line charts, combo charts, and scatter charts.
Customize charts using the chart editor.
Create inline visualizations using sparklines and progress bars.
Use charts and tables in other Google Workspace products and publish charts in Sheets.
Skills you'll practice
Tools you'll use
Details to know

Shareable certificate
Add to your LinkedIn profile
Taught in English
No downloads or installation required
Only available on desktop
See how employees at top companies are mastering in-demand skills

Learn, practice, and apply job-ready skills in less than 2 hours
- Receive training from industry experts
- Gain hands-on experience solving real-world job tasks

About this project
Instructor
Offered by
How you'll learn
Hands-on, project-based learning
Practice new skills by completing job-related tasks with step-by-step instructions.
No downloads or installation required
Access the tools and resources you need in a cloud environment.
Available only on desktop
This project is designed for laptops or desktop computers with a reliable Internet connection, not mobile devices.
Why people choose Coursera for their career

Felipe M.
Learner since 2018
"To be able to take courses at my own pace and rhythm has been an amazing experience. I can learn whenever it fits my schedule and mood."

Jennifer J.
Learner since 2020
"I directly applied the concepts and skills I learned from my courses to an exciting new project at work."

Larry W.
Learner since 2021
"When I need courses on topics that my university doesn't offer, Coursera is one of the best places to go."

Chaitanya A.
"Learning isn't just about being better at your job: it's so much more than that. Coursera allows me to learn without limits."
You might also like

Google Cloud
Google Cloud

Google Cloud