Charting Courses
Charting courses can help you learn data visualization techniques, effective storytelling with data, and the principles of design for charts and graphs. You can build skills in interpreting complex datasets, selecting appropriate chart types, and using color and layout to enhance clarity. Many courses introduce tools like Tableau, Microsoft Excel, and Google Data Studio, that support creating impactful visual representations of data and communicating insights effectively.
Popular Charting Courses and Certifications

Johns Hopkins University
Skills you'll gain: Rmarkdown, Data Visualization, Statistical Visualization, R (Software), Data Import/Export, Data Visualization Software, R Programming, Tidyverse (R Package), Statistical Reporting, Data Manipulation, Data Wrangling, Data Processing, File Management, Software Installation
University of Colorado Boulder
Skills you'll gain: Matplotlib, Statistical Visualization, Seaborn, Data Visualization, Data-Driven Decision-Making, Exploratory Data Analysis, Data Presentation, Plot (Graphics), Data Visualization Software, Descriptive Statistics, Pandas (Python Package), Data Analysis, Statistics, Statistical Analysis, Data Manipulation, Correlation Analysis, Python Programming

Skills you'll gain: Matplotlib, Histogram, Plot (Graphics), Data Visualization, Seaborn, Scatter Plots, Data Visualization Software, Scientific Visualization, Interactive Data Visualization, Statistical Visualization, Exploratory Data Analysis, Graphing, Python Programming
Skills you'll gain: Data Visualization, Plot (Graphics), Data Visualization Software, Statistical Visualization, Interactive Data Visualization, Visualization (Computer Graphics), Javascript, Data Analysis, Microsoft Visual Studio

Skills you'll gain: Plotly, Interactive Data Visualization, Plot (Graphics), Data Visualization Software, Ggplot2, Exploratory Data Analysis, Data Analysis, Python Programming, Data Science, Machine Learning

University of California, Irvine
Skills you'll gain: Data Visualization, Data Visualization Software, Statistical Visualization, Data Presentation, Plot (Graphics), Data Storytelling, Tableau Software, Exploratory Data Analysis, Descriptive Statistics, Data Analysis, Descriptive Analytics, Data Mapping

Skills you'll gain: Medical Privacy, Patient Registration, Health Insurance Portability And Accountability Act (HIPAA) Compliance, Medical Records, Claims Processing, Registration, Health Information Management, Electronic Medical Record System, Clinic Management Systems, Electronic Medical Record, Records Management, Clinical Documentation, Patient Safety, Data Entry, Document Management, Health Informatics, Data Validation, Data Security, Data Integrity, Regulatory Compliance

Google Cloud
Skills you'll gain: Google Cloud Platform, Dashboard Creation, Data Presentation, Data Visualization Software, Data Import/Export, Big Data, Analytics, Cloud Computing
Logical Operations
Skills you'll gain: Data Presentation, Geospatial Information and Technology, Geospatial Mapping, Data Visualization Software, Data Visualization, Plot (Graphics), Pivot Tables And Charts, Business Reporting, Graphing, Microsoft Access, Business Intelligence Software, Business Intelligence, Data Analysis Software, Data Analysis, Microsoft Office

Skills you'll gain: Data Storytelling, Data Presentation, Dashboard, Dashboard Creation, Interactive Data Visualization, Data Visualization, Infographics, Data Visualization Software, Data Ethics, Storytelling, Report Writing, Data-Driven Decision-Making, Generative AI, Web Content Accessibility Guidelines, Responsible AI, AI Integrations

Skills you'll gain: Time Series Analysis and Forecasting, Data Visualization, Statistical Visualization, Plot (Graphics), Data Preprocessing, Box Plots, Anomaly Detection, Plotly, Exploratory Data Analysis, Data Processing, Descriptive Analytics, Python Programming

University of Illinois Urbana-Champaign
Skills you'll gain: Data Visualization, Plot (Graphics), Interactive Data Visualization, Data Presentation, Infographics, Data Visualization Software, Data Wrangling, Data Storytelling, Plotly, Matplotlib, Journalism, Graphing, Graphic and Visual Design, Color Theory, Visual Storytelling, Data Manipulation, Data Transformation, Design Elements And Principles, Data Analysis, Statistical Analysis
In summary, here are 10 of our most popular charting courses
- Getting Started with Data Visualization in R: Johns Hopkins University
- Data Understanding and Visualization: University of Colorado Boulder
- Python for Data Visualization: Matplotlib & Seaborn: Coursera
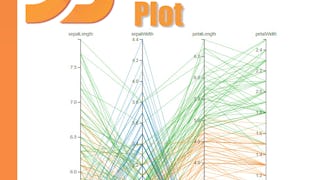
- Simple Parallel Coordinates Plot using d3 js: Coursera
- Data Visualization with Plotly Express: Coursera
- Data Visualization Best Practices: University of California, Irvine
- Charts, HIPAA & Health Data: Medical Records and EHR: Coursera
- Visualizing Billing Data with Google Data Studio: Google Cloud
- Crystal Reports: Charts and Functionality Enhancements: Logical Operations
- Data Visualization and Reporting with Generative AI: Microsoft


