This course introduces the essential mathematical, statistical, and data-handling concepts required to work effectively in football analytics. Learners will build a solid foundation by exploring measures of central tendency, variability, probability distributions, standard deviations, and confidence intervals, the core concepts that underpin all analytical reasoning in sport. Through football-specific examples, the course explains when to use different estimators, how to interpret uncertainty, and why choosing the right distribution is critical when modeling performance and match events.
Must-Know Concepts - Basic requirements for data analysis
Must-Know Concepts - Basic requirements for data analysis
This course is part of Maximum Performance and Technology in Sports Specialization

Instructor: Marisa Sáenz
Access provided by Abu Dhabi National Oil Company
Gain insight into a topic and learn the fundamentals.
Beginner level
Recommended experience
2 weeks to complete
at 10 hours a week
Flexible schedule
Learn at your own pace
What you'll learn
Apply key statistical concepts (means, distributions, variability) to football data.
Understand data types (counting, event, tracking, skeletal) and how they shape analysis.
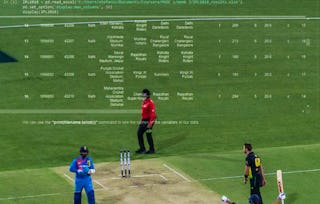
Use Python, APIs, and visualization tools to process and communicate football insights.
Skills you'll gain
- Probability
- Computer Programming Tools
- Data Presentation
- Technical Analysis
- Analytics
- Statistical Methods
- Probability Distribution
- Data Collection
- Statistical Analysis
- Exploratory Data Analysis
- Python Programming
- Data Processing
- Performance Measurement
- Matplotlib
- Data Cleansing
- Skills section collapsed. Showing 9 of 15 skills.
Details to know

Shareable certificate
Add to your LinkedIn profile
Assessments
8 assignments
Taught in English
Recently updated!
December 2025
See how employees at top companies are mastering in-demand skills

Build your subject-matter expertise
This course is part of the Maximum Performance and Technology in Sports Specialization
When you enroll in this course, you'll also be enrolled in this Specialization.
- Learn new concepts from industry experts
- Gain a foundational understanding of a subject or tool
- Develop job-relevant skills with hands-on projects
- Earn a shareable career certificate

There are 4 modules in this course
Build a solid foundation in the mathematical concepts that are crucial for data analysis. This module breaks down various types of averages, explores common data distributions, and demystifies important measures like standard deviation and confidence intervals—empowering you to interpret data with clarity and precision.
What's included
6 videos4 readings2 assignments
Explore the diversity of data in today’s analytical landscape. You’ll learn how to distinguish between basic counting and GPS data, understand the nuances of event data from different providers, and discover advanced tracking and skeleton data that add rich context to sports analysis.
What's included
6 videos3 readings2 assignments1 discussion prompt
Get hands-on with the tools and techniques that bring data to life. This module introduces you to gathering data through APIs and web scraping, processing it using Python and essential data formats, and transforming raw numbers into compelling visuals with platforms like Tableau, Matplotlib, and Power BI.
What's included
6 videos3 readings2 assignments1 discussion prompt
Transform complex analyses into clear, actionable messages. Learn to identify the purpose of your analysis, strike the right balance between detail and simplicity, and use thoughtful chart design to ensure your audience grasps the insights—without being misled.
What's included
6 videos3 readings2 assignments1 discussion prompt
Earn a career certificate
Add this credential to your LinkedIn profile, resume, or CV. Share it on social media and in your performance review.
Instructor
Why people choose Coursera for their career

Felipe M.
Learner since 2018
"To be able to take courses at my own pace and rhythm has been an amazing experience. I can learn whenever it fits my schedule and mood."

Jennifer J.
Learner since 2020
"I directly applied the concepts and skills I learned from my courses to an exciting new project at work."

Larry W.
Learner since 2021
"When I need courses on topics that my university doesn't offer, Coursera is one of the best places to go."

Chaitanya A.
"Learning isn't just about being better at your job: it's so much more than that. Coursera allows me to learn without limits."
Explore more from Data Science
University of Michigan
Real Madrid Graduate School Universidad Europea

Illinois Tech
