Welcome to RStudio for Six Sigma - Control Charts. This is a project-based course which should take under 2 hours to finish. Before diving into the project, please take a look at the course objectives and structure.
RStudio for Six Sigma - Control Charts
Ask Coursera
Learn, practice, and apply job-ready skills with expert guidance
Beginner level
Recommended experience
2 hours
Learn at your own pace
Hands-on learning
What you'll learn
Import datasets into RStudio; plot and interpret Control Charts.
Understand data types (Variables, Attribute Type I & II). Choose the correct Control Chart using the algorithm.
Plot & interpret IMR Charts (XMR), Xbar-R Charts, Xbar-S Charts, NP Charts, P Charts, C Charts and U Charts.
Skills you'll practice
Tools you'll use
Details to know

Shareable certificate
Add to your LinkedIn profile
Taught in English
No downloads or installation required
Only available on desktop
See how employees at top companies are mastering in-demand skills

Learn, practice, and apply job-ready skills in less than 2 hours
- Receive training from industry experts
- Gain hands-on experience solving real-world job tasks
- Build confidence using the latest tools and technologies

About this Guided Project
Learn step-by-step
In a video that plays in a split-screen with your work area, your instructor will walk you through these steps:
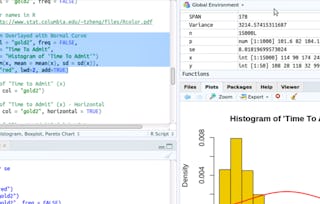
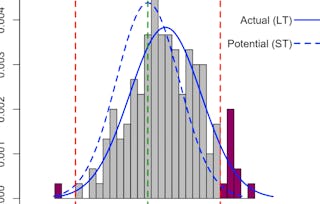
Introduction to RStudio environment; overview of Data Types, Control Chart selection algorithm, and the rules to detect out of control signals in the process (Western Electric & Nelson Rules)
Plot & Interpret IMR (XMR) Chart for real life scenarios
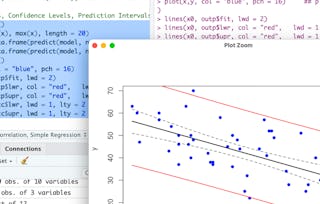
Plot & Interpret Xbar-R Char and Xbar-S Chart for real life scenarios
Plot & Interpret NP Chart and P Chart for real life scenarios
Plot & Interpret C Chart and U Chart for real life scenarios
Recommended experience
Basic Statistics (RStudio for Six Sigma - Basic Descriptive Statistics)
9 project images
Instructor

10 Courses12,336 learners
Offered by
How you'll learn
Skill-based, hands-on learning
Practice new skills by completing job-related tasks.
Expert guidance
Follow along with pre-recorded videos from experts using a unique side-by-side interface.
No downloads or installation required
Access the tools and resources you need in a pre-configured cloud workspace.
Available only on desktop
This Guided Project is designed for laptops or desktop computers with a reliable Internet connection, not mobile devices.
Why people choose Coursera for their career

Felipe M.
Learner since 2018
"To be able to take courses at my own pace and rhythm has been an amazing experience. I can learn whenever it fits my schedule and mood."

Jennifer J.
Learner since 2020
"I directly applied the concepts and skills I learned from my courses to an exciting new project at work."

Larry W.
Learner since 2021
"When I need courses on topics that my university doesn't offer, Coursera is one of the best places to go."

Chaitanya A.
"Learning isn't just about being better at your job: it's so much more than that. Coursera allows me to learn without limits."
You might also like
 Status: Free Trial
Advance your career with an online degree
Earn a degree from world-class universities - 100% online


