Results for "isosurface and flow visualization"
 Status: New
Skills you'll gain: Animations, 3D Assets, 3D Modeling, Animation and Game Design, Computer Graphics, Virtual Environment, Computer Graphic Techniques, Performance Tuning
 Status: Preview
Skills you'll gain: Data Storytelling, Plotly, Matplotlib, Exploratory Data Analysis, Data Visualization, Interactive Data Visualization, Data Visualization Software, Statistical Visualization, Seaborn, Scatter Plots, Data Analysis, Box Plots, Descriptive Statistics, Jupyter, Data Science, Anomaly Detection, Python Programming, GitHub
 Status: NewStatus: Free Trial
Skills you'll gain: Data Preprocessing, Data Visualization, Performance Tuning
 Status: NewStatus: Free Trial
University of Pittsburgh
Skills you'll gain: Data Storytelling, Interactive Data Visualization, Data Visualization Software, Data Presentation, Data Visualization, Tableau Software, Matplotlib, Geospatial Information and Technology, Spatial Analysis, Geospatial Mapping, Visualization (Computer Graphics), Seaborn, Infographics, Heat Maps, Data Ethics, Text Mining, Data Mapping, Network Analysis

Skills you'll gain: Data Visualization Software, Data Visualization, Statistical Visualization, Ggplot2, Plot (Graphics), R Programming, Scatter Plots, Data Collection, Data Analysis, Data Manipulation, Data Import/Export, Regression Analysis, Data Preprocessing, Software Installation
 Status: NewStatus: Free Trial
Dassault Systèmes
 Status: Preview
Board Infinity
Skills you'll gain: Data Visualization Software, Dashboard, Data Visualization, Interactive Data Visualization, Data Transformation, Tableau Software, Data Storytelling, Data Manipulation, Exploratory Data Analysis, Heat Maps, Scatter Plots, Data Analysis, Forecasting, Geospatial Mapping
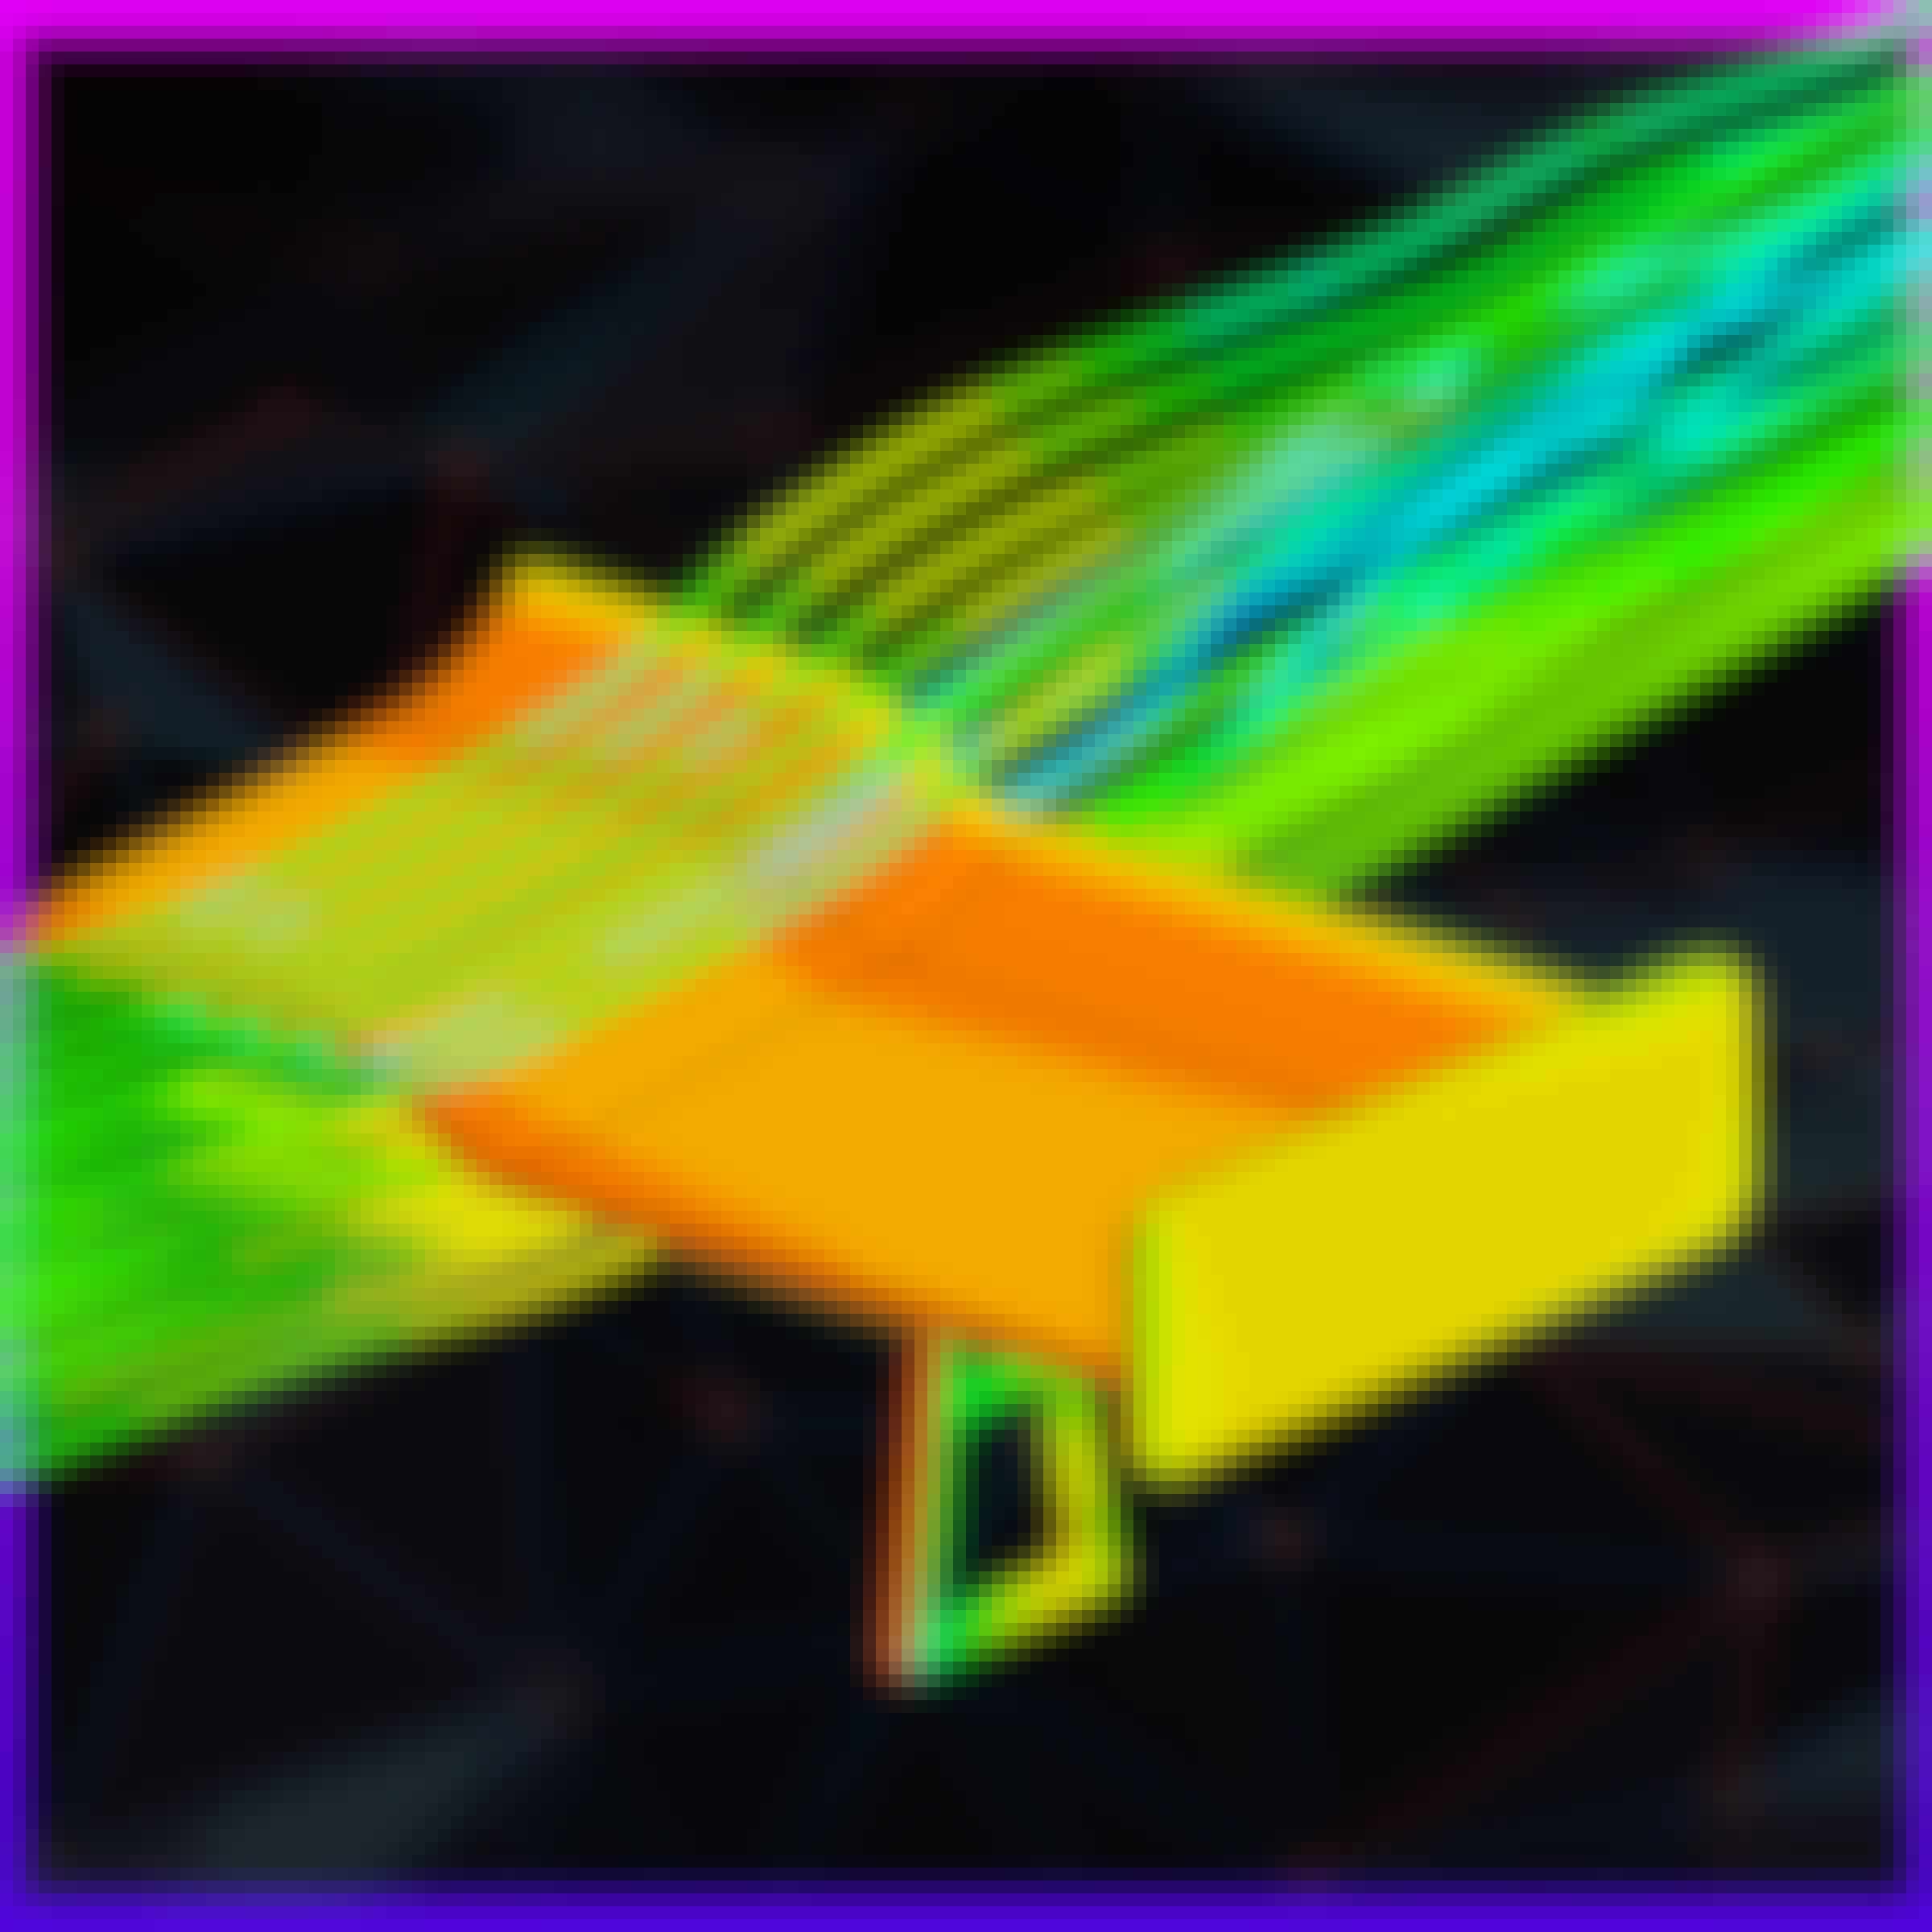
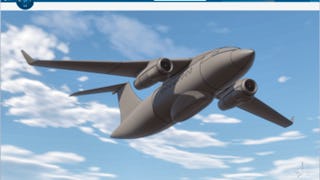
Skills you'll gain: Simulation and Simulation Software, Engineering Analysis, Engineering, Prototyping, Computer-Aided Design, Cloud Computing
 Status: New
Skills you'll gain: 3D Modeling, Computer Graphics, Visualization (Computer Graphics), Animation and Game Design, Graphical Tools, Design Software, Image Quality, Layout Design
 Status: Free Trial
University of California, Irvine
Skills you'll gain: Data Visualization Software, Statistical Visualization, Data Presentation, Plot (Graphics), Data Storytelling, Tableau Software, Exploratory Data Analysis, Descriptive Statistics, Data Analysis, Descriptive Analytics, Histogram
 Status: New
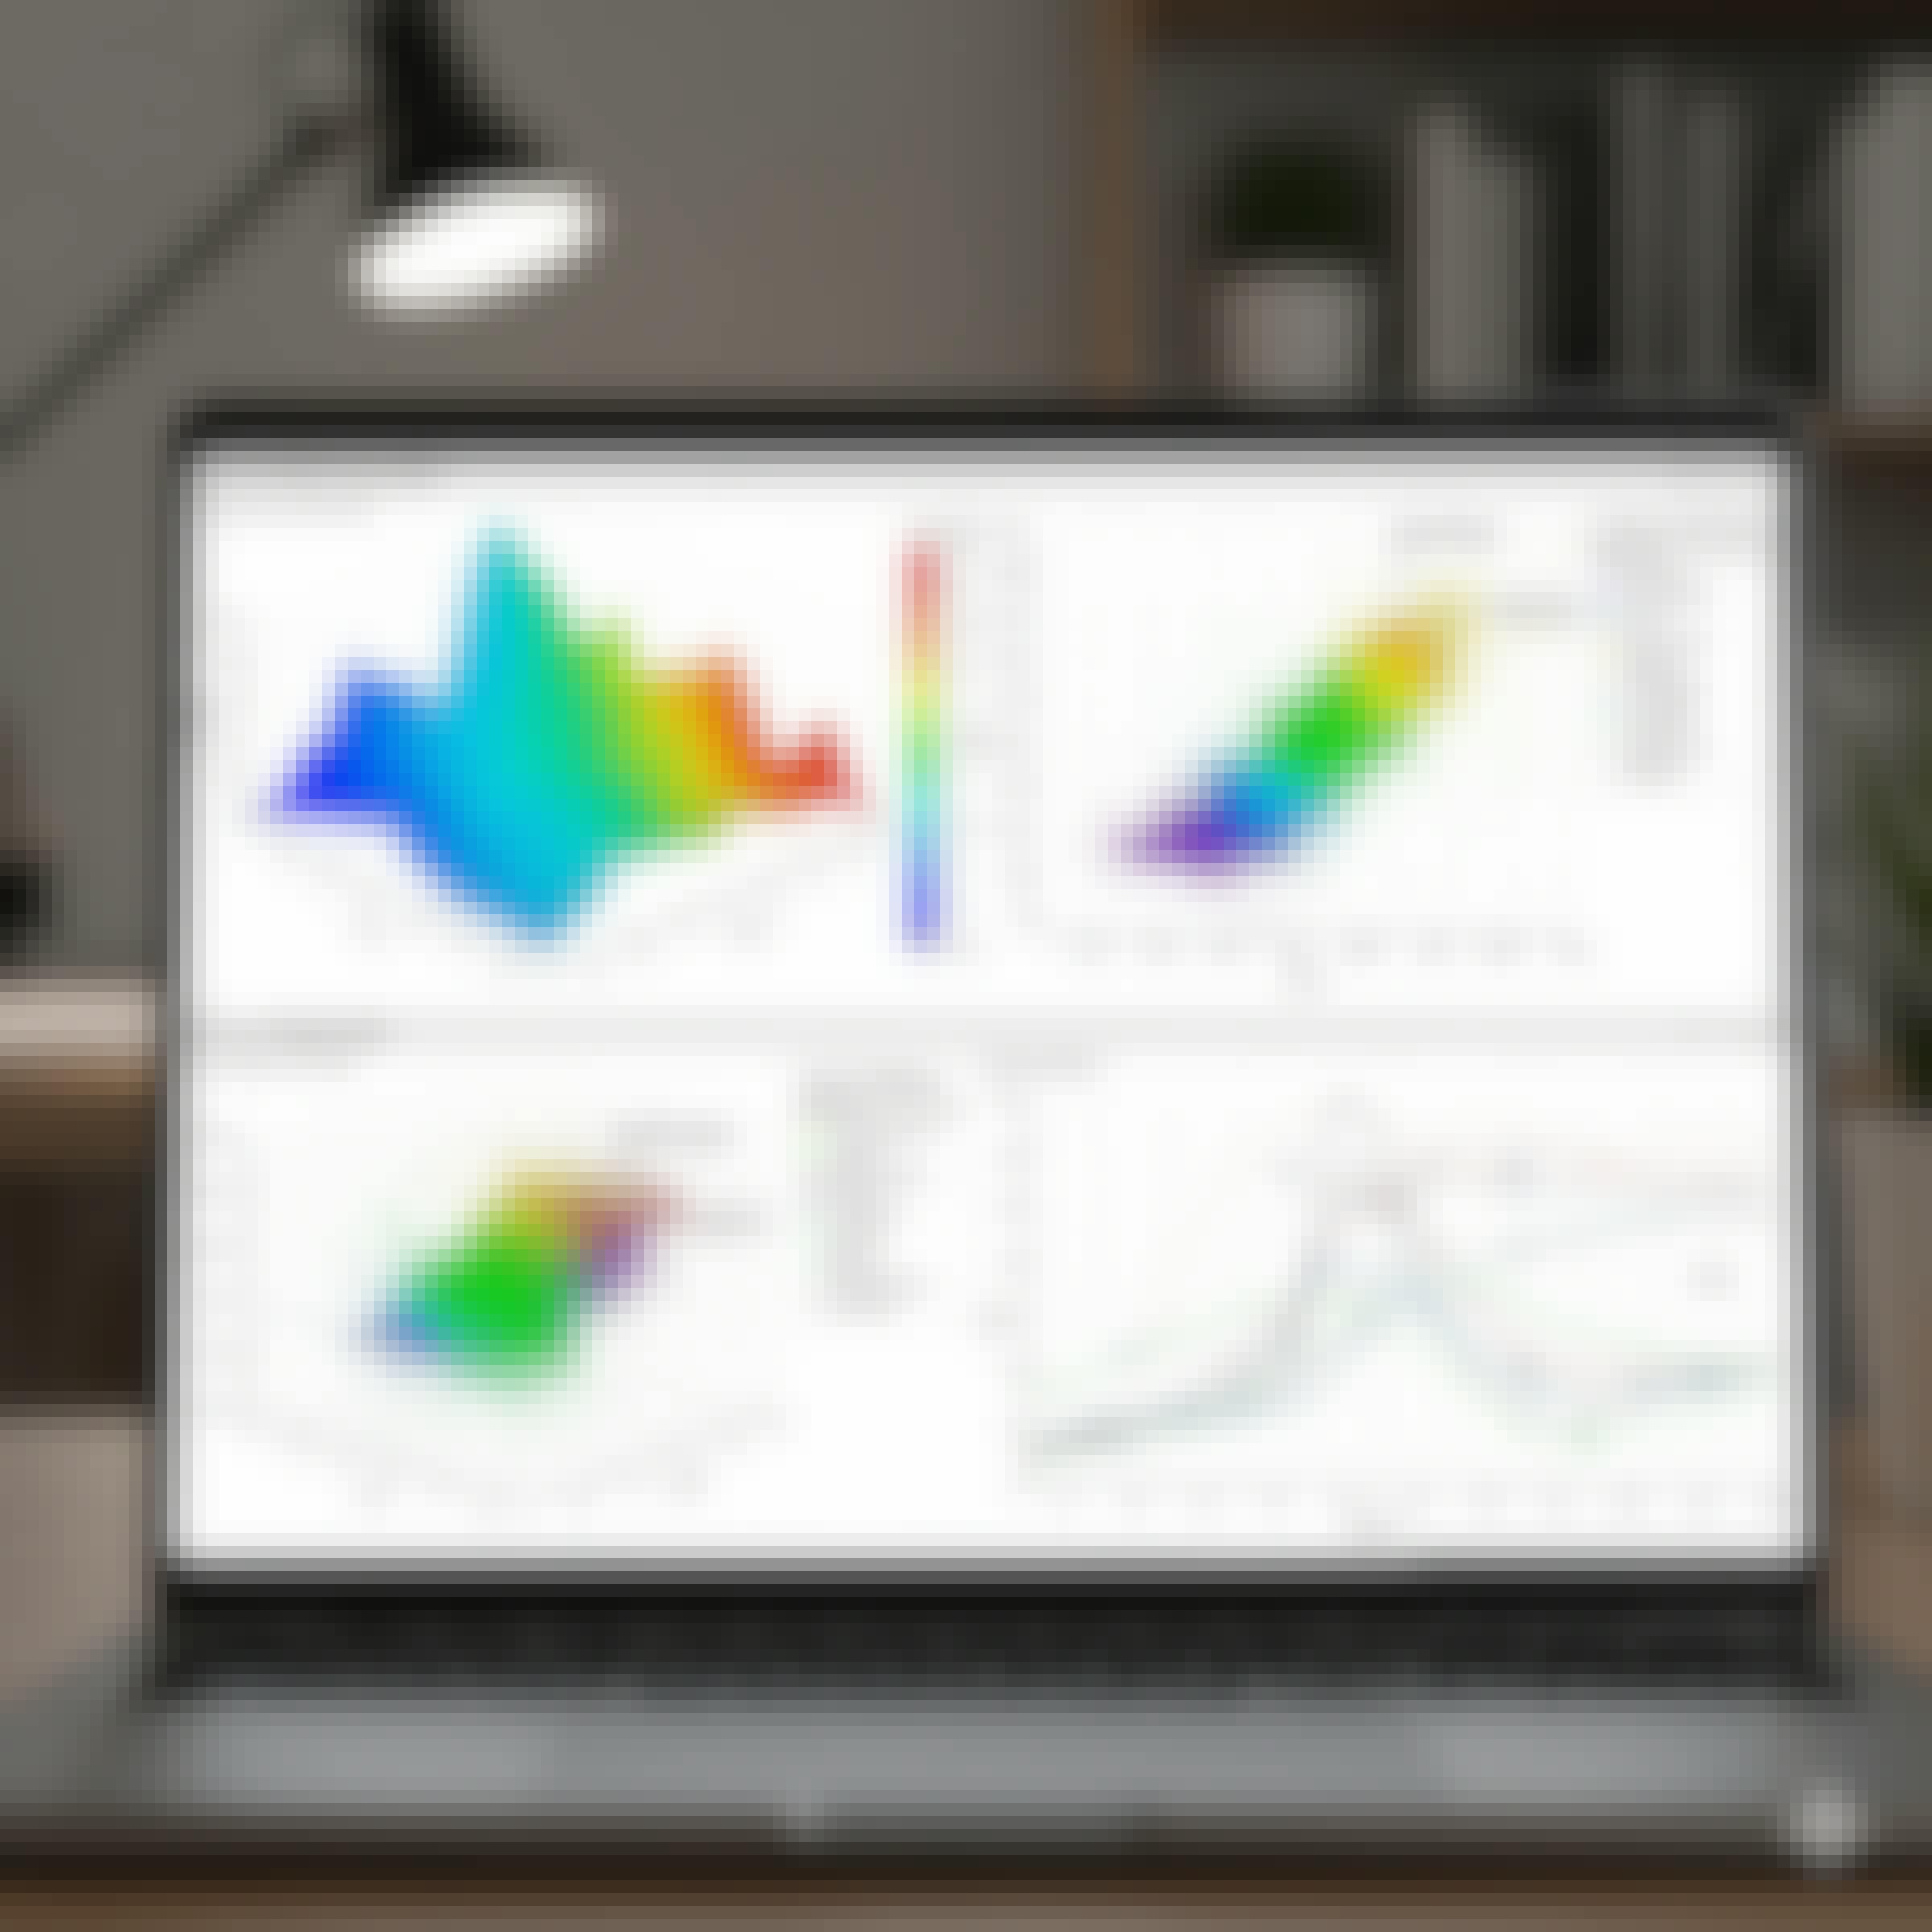 Status: NewStatus: Free Trial
Skills you'll gain: Matplotlib, Scientific Visualization, Visualization (Computer Graphics), Plot (Graphics), Statistical Visualization, Data Visualization Software, Scatter Plots, NumPy, Python Programming
In summary, here are 10 of our most popular isosurface and flow visualization courses
- Geometry Nodes For Blender 4.4: Packt
- Explore and Visualize Data the Python Way: Coursera
- Clean, Analyze, and Visualize Your Data: Coursera
- Interactive, Geospatial & Narrative Data Visualization: University of Pittsburgh
- How to Visualize Data with R: Packt
- Practice CATIA Generative Wireframe and Surface: Dassault Systèmes
- Data Visualization with Tableau: Board Infinity
- Computational Fluid Mechanics - Airflow Around a Spoiler: Coursera
- Mastering the Art of Isometric Room Design in Blender 3: Packt
- Data Visualization Best Practices: University of California, Irvine


