• For Individuals
  • For Businesses
  • For Universities
  • For Governments
Degrees
Log In
Join for Free
  • Browse
  • Splunk Dashboards And Reporting

Results for "splunk+dashboards+and+reporting"


  • G

    Google Cloud

    Looker Data Explorer - Qwik Start

    Skills you'll gain: Looker (Software), Interactive Data Visualization, Dashboard, Data Visualization Software, Data Presentation, Exploratory Data Analysis, Data Access, Data Analysis, Analysis, Google Cloud Platform, Data Management

    Beginner · Project · Less Than 2 Hours

  • G

    Google Cloud

    Datadog: Getting started with the Helm Chart

    Skills you'll gain: Kubernetes, Application Performance Management, YAML, Google Cloud Platform, Configuration Management, Real Time Data, Data Analysis

    2.8
    Rating, 2.8 out of 5 stars
    ·
    9 reviews

    Beginner · Project · Less Than 2 Hours

  • G

    Google Cloud

    Analytics as a Service for Data Sharing Partners

    Skills you'll gain: Dashboard, Data Sharing, Cloud Computing, Big Data, Data Access, Google Cloud Platform, Data Visualization, Data Management

    Beginner · Project · Less Than 2 Hours

  • Status: Free
    Free
    C

    Coursera

    Dashboards in Qlik Sense: Decision-Support Dashboards

    Skills you'll gain: Interactive Data Visualization, Exploratory Data Analysis, Dashboard, Data Visualization Software, Data Integration, Heat Maps, Spatial Data Analysis, Data-Driven Decision-Making, Decision Support Systems, Business Intelligence Software, Geospatial Information and Technology, Data Mapping

    Beginner · Guided Project · Less Than 2 Hours

  • Status: New
    New
    Status: Free Trial
    Free Trial
    E

    EDUCBA

    Analyze Web Logs with Kibana & Elasticsearch

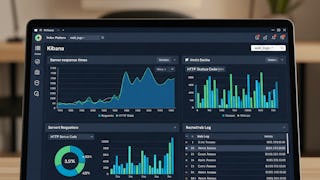
    Skills you'll gain: Kibana, Dashboard, Interactive Data Visualization, Web Analytics, Data Visualization Software, Exploratory Data Analysis, Data Analysis, Business Intelligence, Data Wrangling, Data Import/Export

    Mixed · Course · 1 - 4 Weeks

  • C

    Coursera

    Create and manage a project dashboard with Wrike

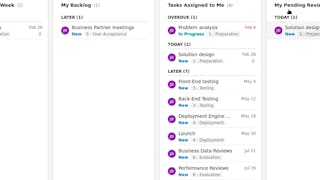
    Skills you'll gain: Dashboard, Project Management Software, Data Import/Export, Workflow Management, Team Management, Project Coordination, Project Management, Project Planning

    4.9
    Rating, 4.9 out of 5 stars
    ·
    9 reviews

    Intermediate · Guided Project · Less Than 2 Hours

  • G

    Google Cloud

    Explore and Create Reports with Data Studio

    Skills you'll gain: Exploratory Data Analysis, Data Visualization Software, Dashboard, Interactive Data Visualization, Data Analysis, Google Analytics, Data Integration

    4.3
    Rating, 4.3 out of 5 stars
    ·
    21 reviews

    Beginner · Project · Less Than 2 Hours

  • Status: Free Trial
    Free Trial
    S

    Scrimba

    API Basics 4: Build a Personal Dashboard (Promise Rejection)

    Skills you'll gain: Responsive Web Design, Cascading Style Sheets (CSS), Web Applications, Javascript, Web Development Tools, Restful API, Application Programming Interface (API), Real Time Data, Software Development

    Intermediate · Course · 1 - 4 Weeks

  • Status: Free
    Free
    C

    Coursera

    Financial Reporting with Tableau: Parameters & Filters

    Skills you'll gain: Dashboard, Tableau Software, Interactive Data Visualization, Financial Reporting, Financial Data, Business Reporting, Financial Statements, Business Intelligence, Financial Statement Analysis, Financial Analysis, Data Visualization Software, Performance Analysis, Key Performance Indicators (KPIs)

    Intermediate · Guided Project · Less Than 2 Hours

  • G

    Google Cloud

    Using BigQuery and Cloud Logging to Analyze BigQuery Usage

    Skills you'll gain: Google Cloud Platform, Big Data, Public Cloud, Cloud Computing, Event Monitoring, Cloud Storage, Data Import/Export, Analytics

    Beginner · Project · Less Than 2 Hours

  • Status: Free
    Free
    C

    Coursera

    Dynamic Dashboards with Tableau: Advanced Sales Analysis

    Skills you'll gain: Dashboard, Data Visualization, Interactive Data Visualization, Data Presentation, Tableau Software, Data Visualization Software, Exploratory Data Analysis, Business Intelligence, Data Analysis

    Intermediate · Guided Project · Less Than 2 Hours

  • Status: Free Trial
    Free Trial
    P

    Packt

    Learn Data Integration and Visualization with Elasticsearch

    Skills you'll gain: Data Import/Export, Data Visualization Software, Data Visualization, Interactive Data Visualization, Histogram, Data Transformation, Data Processing, Apache Kafka, JSON, MySQL, SQL

    Intermediate · Course · 1 - 4 Weeks

1…6789

In summary, here are 10 of our most popular splunk+dashboards+and+reporting courses

  • Looker Data Explorer - Qwik Start: Google Cloud
  • Datadog: Getting started with the Helm Chart: Google Cloud
  • Analytics as a Service for Data Sharing Partners: Google Cloud
  • Dashboards in Qlik Sense: Decision-Support Dashboards: Coursera
  • Analyze Web Logs with Kibana & Elasticsearch: EDUCBA
  • Create and manage a project dashboard with Wrike: Coursera
  • Explore and Create Reports with Data Studio: Google Cloud
  • API Basics 4: Build a Personal Dashboard (Promise Rejection): Scrimba
  • Financial Reporting with Tableau: Parameters & Filters: Coursera
  • Using BigQuery and Cloud Logging to Analyze BigQuery Usage: Google Cloud

Other topics to explore

Arts and Humanities
338 courses
Business
1095 courses
Computer Science
668 courses
Data Science
425 courses
Information Technology
145 courses
Health
471 courses
Math and Logic
70 courses
Personal Development
137 courses
Physical Science and Engineering
413 courses
Social Sciences
401 courses
Language Learning
150 courses

Coursera Footer

Skills

  • Artificial Intelligence (AI)
  • Cybersecurity
  • Data Analytics
  • Digital Marketing
  • English Speaking
  • Generative AI (GenAI)
  • Microsoft Excel
  • Microsoft Power BI
  • Project Management
  • Python

Certificates & Programs

  • Google Cybersecurity Certificate
  • Google Data Analytics Certificate
  • Google IT Support Certificate
  • Google Project Management Certificate
  • Google UX Design Certificate
  • IBM Data Analyst Certificate
  • IBM Data Science Certificate
  • Machine Learning Certificate
  • Microsoft Power BI Data Analyst Certificate
  • UI / UX Design Certificate

Industries & Careers

  • Business
  • Computer Science
  • Data Science
  • Education & Teaching
  • Engineering
  • Finance
  • Healthcare
  • Human Resources (HR)
  • Information Technology (IT)
  • Marketing

Career Resources

  • Career Aptitude Test
  • Examples of Strengths and Weaknesses for Job Interviews
  • High-Income Skills to Learn
  • How Does Cryptocurrency Work?
  • How to Highlight Duplicates in Google Sheets
  • How to Learn Artificial Intelligence
  • Popular Cybersecurity Certifications
  • Preparing for the PMP Certification
  • Signs You Will Get the Job After an Interview
  • What Is Artificial Intelligence?

Coursera

  • About
  • What We Offer
  • Leadership
  • Careers
  • Catalog
  • Coursera Plus
  • Professional Certificates
  • MasterTrack® Certificates
  • Degrees
  • For Enterprise
  • For Government
  • For Campus
  • Become a Partner
  • Social Impact
  • Free Courses
  • Share your Coursera learning story

Community

  • Learners
  • Partners
  • Beta Testers
  • Blog
  • The Coursera Podcast
  • Tech Blog

More

  • Press
  • Investors
  • Terms
  • Privacy
  • Help
  • Accessibility
  • Contact
  • Articles
  • Directory
  • Affiliates
  • Modern Slavery Statement
  • Do Not Sell/Share
Learn Anywhere
Download on the App Store
Get it on Google Play
Logo of Certified B Corporation
© 2025 Coursera Inc. All rights reserved.
  • Coursera Facebook
  • Coursera Linkedin
  • Coursera Twitter
  • Coursera YouTube
  • Coursera Instagram
  • Coursera TikTok