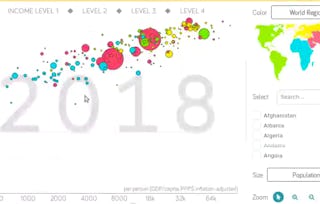
Welcome to this 1 hour long guided project on Data Visualization using Plotly. Plotly is a python graphing library which is used to make interactive, publication-quality graphs. It allows users to import, copy and paste, or stream data to be analyzed and visualized.

Data Visualization using Plotly

(50 reviews)
Recommended experience
What you'll learn
Basics of Exploratory Data Analysis and Plotly and install it on your colab noteboo
Learn how to import necessary libraries and visualize data through simple as well as multi line plots with different markers using plotly
Visualize data through barplots, Area Chart and Stacked Area Chart using plotly
Skills you'll practice
Details to know

Add to your LinkedIn profile
Only available on desktop
See how employees at top companies are mastering in-demand skills

Learn, practice, and apply job-ready skills in less than 2 hours
- Receive training from industry experts
- Gain hands-on experience solving real-world job tasks
- Build confidence using the latest tools and technologies

About this Guided Project
Learn step-by-step
In a video that plays in a split-screen with your work area, your instructor will walk you through these steps:
-
Learner Task 1 : You will be able to learn the basics of Exploratory Data Analysis, Plotly and install it on your colab notebook
-
Learner Task 2 : You will be able to learn how to import necessary libraries and visualize data through simple as well as multi line plots with different markers using plotly
-
Learner Task 3 : You will be able to visualize data through barplots, Area Chart and Stacked Area Chart using plotly
-
Learner Task 4 : You will be able to visualize data through Pie Chart and Multilevel Piechart using plotly
-
Learner Task 5 : You will be able to visualize data through scatter plot using plotly
Recommended experience
Some elementary knowledge of Python and Pandas
5 project images
Instructor

Offered by
How you'll learn
Skill-based, hands-on learning
Practice new skills by completing job-related tasks.
Expert guidance
Follow along with pre-recorded videos from experts using a unique side-by-side interface.
No downloads or installation required
Access the tools and resources you need in a pre-configured cloud workspace.
Available only on desktop
This Guided Project is designed for laptops or desktop computers with a reliable Internet connection, not mobile devices.
Why people choose Coursera for their career

Felipe M.

Jennifer J.

Larry W.

Chaitanya A.
Learner reviews
- 5 stars
48%
- 4 stars
30%
- 3 stars
6%
- 2 stars
4%
- 1 star
12%
Showing 3 of 50
Reviewed on Apr 13, 2022
Hello! I recommend downloading the videos because you have limited time when doing this project. I learned a lot by watching them over & over and running the code in Jupyter notebook.
You might also like

Open new doors with Coursera Plus
Unlimited access to 10,000+ world-class courses, hands-on projects, and job-ready certificate programs - all included in your subscription
Advance your career with an online degree
Earn a degree from world-class universities - 100% online
Join over 3,400 global companies that choose Coursera for Business
Upskill your employees to excel in the digital economy
Frequently asked questions
Because your workspace contains a cloud desktop that is sized for a laptop or desktop computer, Guided Projects are not available on your mobile device.
Guided Project instructors are subject matter experts who have experience in the skill, tool or domain of their project and are passionate about sharing their knowledge to impact millions of learners around the world.
You can download and keep any of your created files from the Guided Project. To do so, you can use the “File Browser” feature while you are accessing your cloud desktop.


