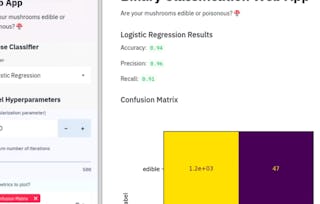
Welcome to this hands-on project on building your first interactive, data dashboard with the Streamlit library in Python. By the end of this project, you are going to be comfortable with using Python and Streamlit to build beautiful and interactive dashboards and web apps, all with zero web development experience! We are going to load, explore, visualize and interact with data, and generate dashboards in less than 150 lines of Python code!

Create Interactive Dashboards with Streamlit and Python

Create Interactive Dashboards with Streamlit and Python

Instructor: Snehan Kekre
14,540 already enrolled
Included with
(402 reviews)
Recommended experience
What you'll learn
Build interactive data dashboards with Streamlit and Python
Use Pandas for data manipulation in data science workflows
Create interactive plots with Plotly Python
Skills you'll practice
Details to know

Add to your LinkedIn profile
Only available on desktop
See how employees at top companies are mastering in-demand skills

Learn, practice, and apply job-ready skills in less than 2 hours
- Receive training from industry experts
- Gain hands-on experience solving real-world job tasks
- Build confidence using the latest tools and technologies

About this Guided Project
Learn step-by-step
In a video that plays in a split-screen with your work area, your instructor will walk you through these steps:
-
Project Overview and Demo
-
Turn Simple Python Scripts into Web Apps
-
Load the Twitter US Airline Sentiment Data
-
Display Tweets in the Sidebar
-
Plot Interactive Bar Plots and Pie Charts
-
Plotting Location Data on an Interactive Map
-
Plot Number of Tweets by Sentiment for Each Airline
-
Word Cloud for Positive, Neutral, and Negative Tweets
Recommended experience
Prior experience with Python scripting and the use of the pandas library is recommended. Bonus if you have worked with Plotly before.
6 project images
Instructor

Offered by
How you'll learn
Skill-based, hands-on learning
Practice new skills by completing job-related tasks.
Expert guidance
Follow along with pre-recorded videos from experts using a unique side-by-side interface.
No downloads or installation required
Access the tools and resources you need in a pre-configured cloud workspace.
Available only on desktop
This Guided Project is designed for laptops or desktop computers with a reliable Internet connection, not mobile devices.
Why people choose Coursera for their career

Felipe M.

Jennifer J.

Larry W.

Chaitanya A.
Learner reviews
- 5 stars
74.87%
- 4 stars
21.64%
- 3 stars
1.24%
- 2 stars
1.24%
- 1 star
0.99%
Showing 3 of 402
Reviewed on Aug 31, 2020
This project it is a great opportunity to learn something new!
Reviewed on May 29, 2020
A perfect start for me using Coursera projects. The project was nicely structured and easily understandable.
Reviewed on Jul 11, 2020
This was such a great course! I absolutely loved it.
You might also like
 Status: Free
 Status: Free Trial

Open new doors with Coursera Plus
Unlimited access to 10,000+ world-class courses, hands-on projects, and job-ready certificate programs - all included in your subscription
Advance your career with an online degree
Earn a degree from world-class universities - 100% online
Join over 3,400 global companies that choose Coursera for Business
Upskill your employees to excel in the digital economy
Frequently asked questions
By purchasing a Guided Project, you'll get everything you need to complete the Guided Project including access to a cloud desktop workspace through your web browser that contains the files and software you need to get started, plus step-by-step video instruction from a subject matter expert.
Because your workspace contains a cloud desktop that is sized for a laptop or desktop computer, Guided Projects are not available on your mobile device.
Guided Project instructors are subject matter experts who have experience in the skill, tool or domain of their project and are passionate about sharing their knowledge to impact millions of learners around the world.


