Results for "report and dashboard design"
 Status: NewStatus: Preview
Skills you'll gain: Data Storytelling, Dashboard, Data Presentation, Power BI, Strategic Decision-Making, Interactive Data Visualization, Tableau Software, Storytelling, Data-Driven Decision-Making, Executive Presence, Business Intelligence, User Feedback, Data Visualization, Presentations, Constructive Feedback, Analytics, Customer Insights, Data Structures
Skills you'll gain: Data Storytelling, Data Presentation, Data-Driven Decision-Making, Data Visualization, Interactive Data Visualization, Dashboard, Data Visualization Software, Tableau Software, Data Analysis, Exploratory Data Analysis
 Status: Free Trial
Johns Hopkins University
Skills you'll gain: Shiny (R Package), Dashboard, Ggplot2, Interactive Data Visualization, Data Visualization Software, Statistical Visualization, Data Presentation, Application Development, UI Components, User Interface (UI), Application Deployment

Skills you'll gain: Data Visualization, Microsoft Excel, Data Visualization Software, Data Import/Export, Business Reporting, Report Writing, Microsoft 365
 Status: Free
Skills you'll gain: Dashboard, Interactive Data Visualization, Tableau Software, Data Presentation, Data Import/Export, Data Visualization, Data Visualization Software, Business Intelligence, Data Analysis, Data Integration, Data Modeling
 Status: Free Trial
Splunk Inc.
Skills you'll gain: Splunk, Interactive Data Visualization, Data Mapping, Performance Tuning, Geospatial Mapping, Wireframing, Extensible Markup Language (XML), Prototyping

Skills you'll gain: Presentations, Sales Presentations, Data Visualization, Productivity Software, Design
 Status: Free
Skills you'll gain: Dashboard, Interactive Data Visualization, Data Presentation, Tableau Software, Data Visualization Software, Data Analysis Software, Digital Publishing, Key Performance Indicators (KPIs), Data Import/Export
 Status: Free Trial
Corporate Finance Institute
Skills you'll gain: Tableau Software, Excel Formulas, Data Modeling, Dashboard, E-Commerce, Data Visualization Software, Performance Analysis, Interactive Data Visualization, Data Analysis, Regional Sales, Business Analysis, Key Performance Indicators (KPIs), Business Metrics, Branding

Skills you'll gain: Project Management Software, Dashboard, Project Management, Calendar Management, Collaborative Software, Milestones (Project Management)
 Status: Free Trial
University of Pennsylvania
Skills you'll gain: Data Storytelling, Data Presentation, Data Visualization Software, Data Visualization, Tableau Software, Presentations, Verbal Communication Skills, Data-Driven Decision-Making, Data Analysis, Scatter Plots, Stakeholder Communications, Spatial Analysis, Trend Analysis
 Status: Free
Skills you'll gain: CI/CD, Continuous Integration, Jenkins, Continuous Deployment, DevOps, Devops Tools, Build Tools, User Accounts, Configuration Management, Continuous Monitoring, Application Programming Interface (API), Authorization (Computing)
In summary, here are 10 of our most popular report and dashboard design courses
- Data Storytelling: Create Insights with Power BI & Tableau: Coursera
- Data Visualization in Tableau: Create Dashboards and Stories: Coursera
- Publishing Visualizations in R with Shiny and flexdashboard: Johns Hopkins University
- Data Visualization using Microsoft Excel: Coursera
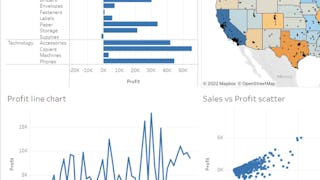
- Multi-Table data analysis with Tableau: Customer Analysis: Coursera
- Splunk Knowledge Manager 103: Splunk Inc.
- Presenting Data Using Charts with Canva: Coursera
- Tableau Public for Beginners: Data Visualization Basics: Coursera
- Tableau Fundamentals Case Study - Ecommerce Analysis: Corporate Finance Institute
- Create a Project Management Dashboard using Bitrix24: Coursera


