• For Individuals
  • For Businesses
  • For Universities
  • For Governments
Log In
Join for Free
  • Browse
  • Graphentheorie

Results for "graphentheorie"


  • Status: Preview
    Preview
    T

    The University of Melbourne

    Sexing the Canvas: Art and Gender

    Skills you'll gain: Art History, Diversity Awareness, Sociology, Cultural Diversity, World History, Research

    4.6
    Rating, 4.6 out of 5 stars
    ·
    433 reviews

    Beginner · Course · 1 - 3 Months

  • C

    Coursera

    Créer une carte de visite professionnelle avec Canva

    Skills you'll gain: Canva (Software), Marketing Design, Graphic Design, Color Theory, Graphic and Visual Design Software, Graphic and Visual Design, Creative Design, Marketing Collateral, Content Creation, Marketing, Business Communication, Entrepreneurship

    Beginner · Guided Project · Less Than 2 Hours

  • Status: New
    New
    Status: Free Trial
    Free Trial
    S

    Skillshare

    Surface Pattern Design by Hand: Repeat Patterns on Paper

    Skills you'll gain: Design Elements And Principles, Design, Adobe Photoshop, Digital Design, Creativity

    Beginner · Course · 1 - 4 Weeks

  • Status: Free Trial
    Free Trial
    J

    Johns Hopkins University

    Publishing Visualizations in R with Shiny and flexdashboard

    Skills you'll gain: Shiny (R Package), Dashboard, Ggplot2, Interactive Data Visualization, Data Visualization Software, Statistical Visualization, Data Presentation, Application Development, UI Components, User Interface (UI), Application Deployment

    4.9
    Rating, 4.9 out of 5 stars
    ·
    70 reviews

    Mixed · Course · 1 - 4 Weeks

  • Status: Free Trial
    Free Trial
    J

    Johns Hopkins University

    Data Visualization in R with ggplot2

    Skills you'll gain: Ggplot2, Scatter Plots, Plot (Graphics), Data Visualization, Data Visualization Software, Heat Maps, R Programming, Graphical Tools, Data Wrangling, Tidyverse (R Package), Graphics Software

    4.9
    Rating, 4.9 out of 5 stars
    ·
    130 reviews

    Intermediate · Course · 1 - 4 Weeks

  • C

    Coursera

    Créez des infographies avec Piktochart

    Skills you'll gain: Infographics, Data Visualization, Process Flow Diagrams, Presentations, Content Creation, Marketing Collateral, Graphic Design, Business Analytics

    Beginner · Guided Project · Less Than 2 Hours

  • Status: New
    New
    Status: Free Trial
    Free Trial
    S

    Skillshare

    Strategic SEO: A Quick Start to Reach a Wider Audience

    Skills you'll gain: Keyword Research, Search Engine Optimization, Target Audience, Blogs, Web Analytics and SEO, Content Strategy, Social Media Strategy, Content Creation, Web Content

    Beginner · Course · 1 - 4 Weeks

  • C

    Coursera

    Netzkonvergenzstudien in der Finiten Elemente Methode

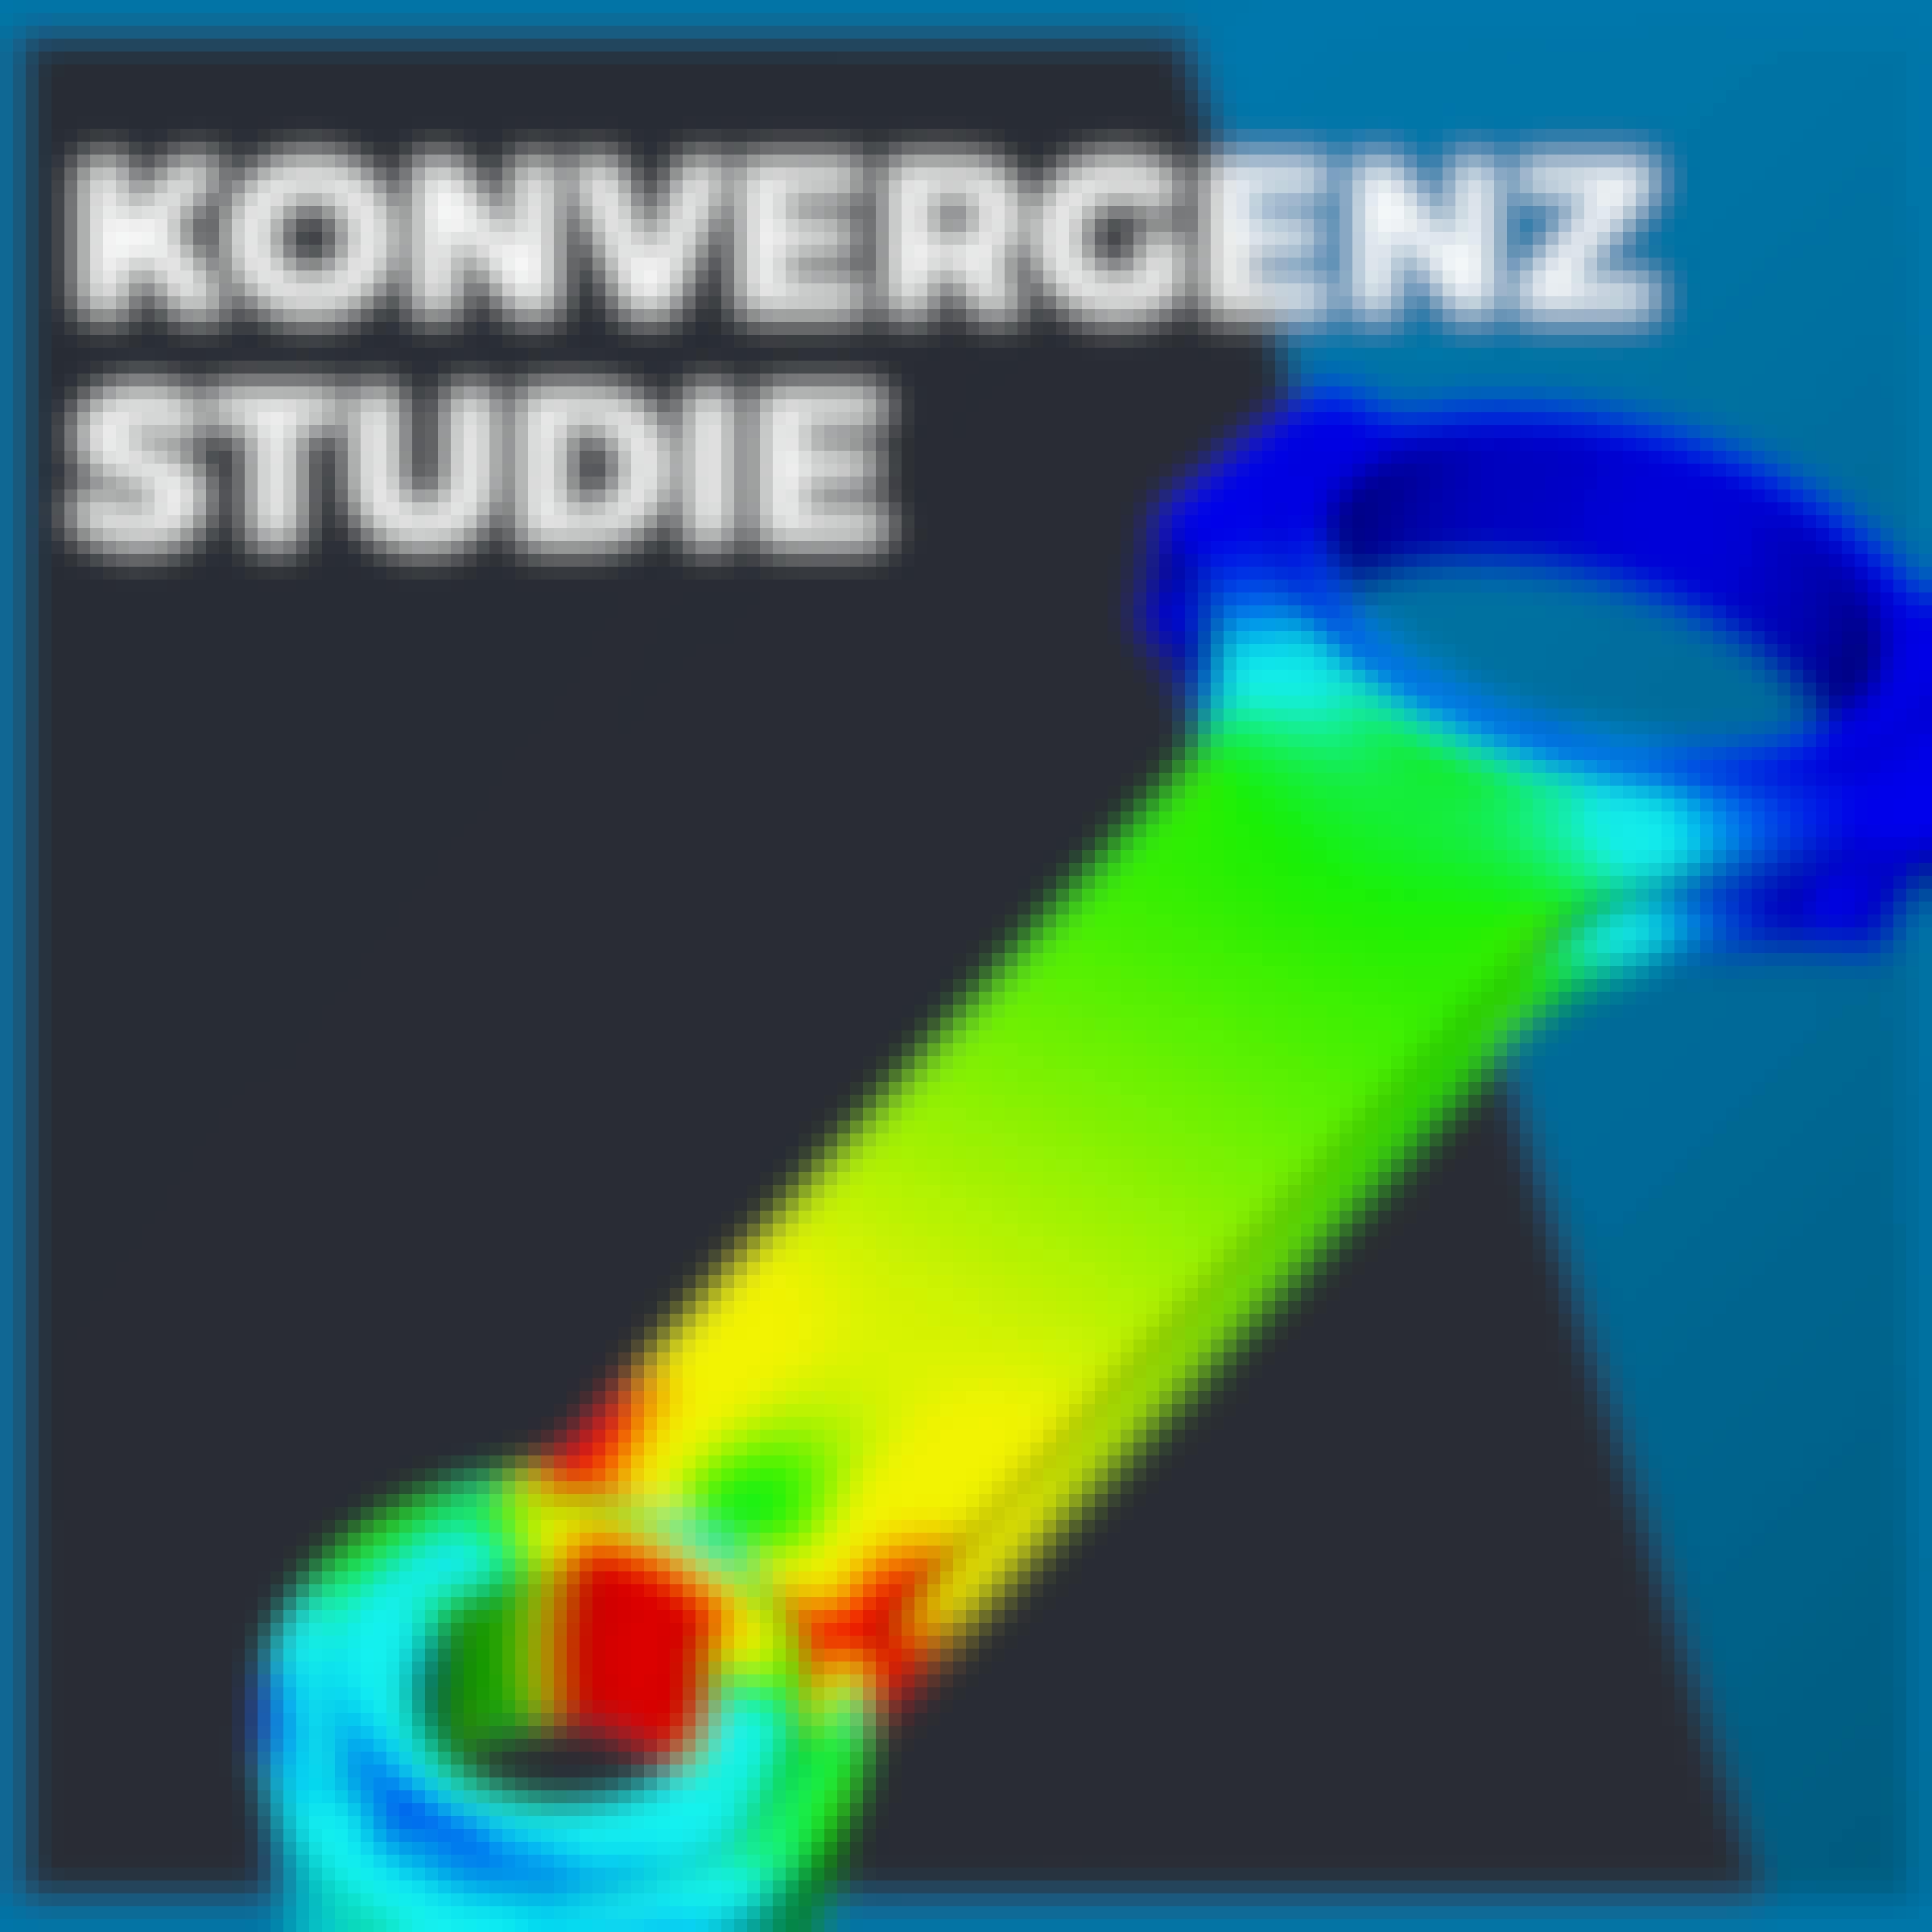
    Skills you'll gain: Finite Element Methods, Simulation and Simulation Software, Simulations, Mathematical Modeling, Engineering Analysis, 3D Modeling, Scientific Visualization, Cloud Computing, Structural Analysis

    Beginner · Guided Project · Less Than 2 Hours

  • C

    Coursera

    Interactive Statistical Data Visualization 101

    Skills you'll gain: Plotly, Plot (Graphics), Data Visualization, Statistical Visualization, Box Plots, Scatter Plots, Interactive Data Visualization, Data Visualization Software, Histogram, Statistical Analysis, Data Analysis, Probability

    4.9
    Rating, 4.9 out of 5 stars
    ·
    10 reviews

    Beginner · Guided Project · Less Than 2 Hours

  • C

    Coursera

    Débuter avec ImageJ

    Skills you'll gain: Image Analysis, Data Analysis Software, Data Analysis, Scientific Visualization, Histogram, Analysis, Exploratory Data Analysis, Software Installation

    Beginner · Guided Project · Less Than 2 Hours

  • C

    Coursera

    Create an Affinity Diagram Using Creately

    Skills you'll gain: Process Flow Diagrams, Ideation, Brainstorming, Cooperation, Teamwork, Creativity, Data Visualization, Creative Thinking, Organizational Skills, Productivity

    Beginner · Guided Project · Less Than 2 Hours

  • C

    Coursera

    Choisir la Meilleure Méthode pour Illustrer les Données

    Skills you'll gain: Datamaps, Interactive Data Visualization, Heat Maps, Data Visualization, Data Visualization Software, Statistical Visualization, Data Presentation, Data Storytelling, Data Wrangling, Data Access, Correlation Analysis, Scatter Plots, Exploratory Data Analysis, Data Science, Data Analysis, Python Programming

    4.4
    Rating, 4.4 out of 5 stars
    ·
    10 reviews

    Beginner · Guided Project · Less Than 2 Hours

1…678…9

In summary, here are 10 of our most popular graphentheorie courses

  • Sexing the Canvas: Art and Gender: The University of Melbourne
  • Créer une carte de visite professionnelle avec Canva: Coursera
  • Surface Pattern Design by Hand: Repeat Patterns on Paper: Skillshare
  • Publishing Visualizations in R with Shiny and flexdashboard: Johns Hopkins University
  • Data Visualization in R with ggplot2: Johns Hopkins University
  • Créez des infographies avec Piktochart: Coursera
  • Strategic SEO: A Quick Start to Reach a Wider Audience: Skillshare
  • Netzkonvergenzstudien in der Finiten Elemente Methode: Coursera
  • Interactive Statistical Data Visualization 101: Coursera
  • Débuter avec ImageJ: Coursera

Other topics to explore

Arts and Humanities
338 courses
Business
1095 courses
Computer Science
668 courses
Data Science
425 courses
Information Technology
145 courses
Health
471 courses
Math and Logic
70 courses
Personal Development
137 courses
Physical Science and Engineering
413 courses
Social Sciences
401 courses
Language Learning
150 courses

Coursera Footer

Skills

  • Artificial Intelligence (AI)
  • Cybersecurity
  • Data Analytics
  • Digital Marketing
  • English Speaking
  • Generative AI (GenAI)
  • Microsoft Excel
  • Microsoft Power BI
  • Project Management
  • Python

Certificates & Programs

  • Google Cybersecurity Certificate
  • Google Data Analytics Certificate
  • Google IT Support Certificate
  • Google Project Management Certificate
  • Google UX Design Certificate
  • IBM Data Analyst Certificate
  • IBM Data Science Certificate
  • Machine Learning Certificate
  • Microsoft Power BI Data Analyst Certificate
  • UI / UX Design Certificate

Industries & Careers

  • Business
  • Computer Science
  • Data Science
  • Education & Teaching
  • Engineering
  • Finance
  • Healthcare
  • Human Resources (HR)
  • Information Technology (IT)
  • Marketing

Career Resources

  • Career Aptitude Test
  • Examples of Strengths and Weaknesses for Job Interviews
  • High-Income Skills to Learn
  • How Does Cryptocurrency Work?
  • How to Highlight Duplicates in Google Sheets
  • How to Learn Artificial Intelligence
  • Popular Cybersecurity Certifications
  • Preparing for the PMP Certification
  • Signs You Will Get the Job After an Interview
  • What Is Artificial Intelligence?

Coursera

  • About
  • What We Offer
  • Leadership
  • Careers
  • Catalog
  • Coursera Plus
  • Professional Certificates
  • MasterTrack® Certificates
  • Degrees
  • For Enterprise
  • For Government
  • For Campus
  • Become a Partner
  • Social Impact
  • Free Courses
  • Share your Coursera learning story

Community

  • Learners
  • Partners
  • Beta Testers
  • Blog
  • The Coursera Podcast
  • Tech Blog

More

  • Press
  • Investors
  • Terms
  • Privacy
  • Help
  • Accessibility
  • Contact
  • Articles
  • Directory
  • Affiliates
  • Modern Slavery Statement
  • Do Not Sell/Share
Learn Anywhere
Download on the App Store
Get it on Google Play
Logo of Certified B Corporation
© 2025 Coursera Inc. All rights reserved.
  • Coursera Facebook
  • Coursera Linkedin
  • Coursera Twitter
  • Coursera YouTube
  • Coursera Instagram
  • Coursera TikTok