• For Individuals
  • For Businesses
  • For Universities
  • For Governments
Degrees
​
Log In
Join for Free
  • Browse
  • Interactive Visualization Design

Results for "interactive visualization design"


  • C

    Coursera

    Use Canva to Design Digital Course Collateral

    Skills you'll gain: Canva (Software), Color Theory, Developing Training Materials, Digital Design, Design Elements And Principles, Graphic Design, Marketing, Social Media

    4.6
    Rating, 4.6 out of 5 stars
    ·
    1.6K reviews

    Advanced · Guided Project · Less Than 2 Hours

  • Status: Free Trial
    Free Trial
    X

    Xbox

    Xbox Graphic Designer

    Skills you'll gain: Color Theory, User Interface and User Experience (UI/UX) Design, Logo Design, Typography, Interaction Design, Figma (Design Software), Adobe Illustrator, Wireframing, Marketing Design, Marketing Materials, Layout Design, Usability, Web Content Accessibility Guidelines, Graphic Design, User Centered Design, Photo Editing, Peer Review, Adobe Firefly, Game Design, Adobe Photoshop

    4.5
    Rating, 4.5 out of 5 stars
    ·
    77 reviews

    Beginner · Professional Certificate · 3 - 6 Months

  • Status: New
    New
    Status: Free Trial
    Free Trial
    E

    EDUCBA

    Matplotlib with Python: E-commerce Data Visualization

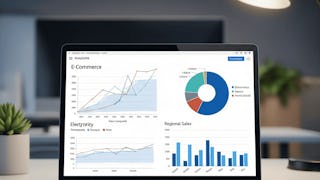
    Skills you'll gain: Matplotlib, Data Preprocessing, Box Plots, E-Commerce, Business Analytics, Data Visualization Software, Histogram, Data Analysis, Scatter Plots, Exploratory Data Analysis, Pandas (Python Package), Jupyter, Software Installation

    Mixed · Course · 1 - 4 Weeks

  • Status: Free Trial
    Free Trial
    P

    Packt

    Data Analytics and Visualization with Tableau and more

    Skills you'll gain: R Programming, Alteryx, Statistical Programming, Tableau Software, Data Cleansing, Data Visualization Software, Dashboard, Data Visualization, Data Storytelling, Interactive Data Visualization, Data Presentation, Data Structures, Statistical Analysis, Workflow Management, Data Analysis, Data Processing, Data Manipulation, Data Transformation, Data Import/Export

    Intermediate · Course · 1 - 4 Weeks

  • Status: Free Trial
    Free Trial
    M

    Microsoft

    Advanced Data Analysis & Visualization with Copilot in Excel

    Skills you'll gain: Microsoft Excel, Pivot Tables And Charts, Excel Formulas, Data Presentation, Data Storytelling, Data Visualization Software, Microsoft Copilot, Statistical Analysis, Data Analysis, Statistical Methods, Data Integration, Data-Driven Decision-Making

    4.3
    Rating, 4.3 out of 5 stars
    ·
    33 reviews

    Beginner · Course · 1 - 3 Months

  • Status: Free Trial
    Free Trial
    U

    University of Minnesota

    User Interface Design

    Skills you'll gain: UI/UX Research, User Research, Design Research, User Interface (UI), User Interface (UI) Design, Usability Testing, Prototyping, Usability, User Experience, User Centered Design, Graphic and Visual Design, Ideation, Web Content Accessibility Guidelines, Design, Peer Review, User Experience Design, Human Computer Interaction, Interaction Design, Qualitative Research, Mockups

    4.6
    Rating, 4.6 out of 5 stars
    ·
    1.8K reviews

    Intermediate · Specialization · 3 - 6 Months

  • C

    Coursera

    Data Visualization using dplyr and ggplot2 in R

    Skills you'll gain: Ggplot2, Tidyverse (R Package), Data Visualization, Data Analysis, Exploratory Data Analysis, R Programming, Data Visualization Software, Data Manipulation, R (Software)

    5
    Rating, 5 out of 5 stars
    ·
    20 reviews

    Intermediate · Guided Project · Less Than 2 Hours

  • C

    Coursera

    Covid-19 Death Medical Analysis & Visualization using Plotly

    Skills you'll gain: Plotly, Data Visualization, Datamaps, Data Visualization Software, Scatter Plots, Jupyter, Python Programming, Exploratory Data Analysis, Pandas (Python Package), Data Analysis, Medical Science and Research

    4.2
    Rating, 4.2 out of 5 stars
    ·
    13 reviews

    Beginner · Guided Project · Less Than 2 Hours

  • Status: Free Trial
    Free Trial
    U

    Università di Napoli Federico II

    Data Visualization e manipolazione dei dati con Tableau

    Skills you'll gain: Data Integration, Tableau Software, Geographic Information Systems, Spatial Analysis, Data Manipulation, Data Analysis, Data Visualization Software, Data Transformation, Data Visualization, Interactive Data Visualization

    Intermediate · Course · 1 - 3 Months

  • Status: Free Trial
    Free Trial
    E

    EDUCBA

    MAYA Architecture - Setting Up Interior Floor Map

    Skills you'll gain: 3D Assets

    4.8
    Rating, 4.8 out of 5 stars
    ·
    11 reviews

    Beginner · Course · 1 - 4 Weeks

  • C

    Coursera

    Real-time data visualization dashboard using Node-red

    Skills you'll gain: Dashboard, Data Preprocessing, Data Visualization Software, Real Time Data, Node.JS, Data Analysis, Application Programming Interface (API), Web Development Tools, JSON, Javascript

    4.3
    Rating, 4.3 out of 5 stars
    ·
    18 reviews

    Intermediate · Guided Project · Less Than 2 Hours

  • Status: Free Trial
    Free Trial
    U

    University of London

    Responsive Web Design

    Skills you'll gain: Responsive Web Design, HTML and CSS, Web Design, Human Computer Interaction, Interaction Design, Web Design and Development, Bootstrap (Front-End Framework), Usability, User Interface and User Experience (UI/UX) Design, Wireframing, Cascading Style Sheets (CSS), Data Structures, Web Components, Javascript

    4.6
    Rating, 4.6 out of 5 stars
    ·
    1.9K reviews

    Mixed · Course · 1 - 3 Months

1…242526…764

In summary, here are 10 of our most popular interactive visualization design courses

  • Use Canva to Design Digital Course Collateral: Coursera
  • Xbox Graphic Designer: Xbox
  • Matplotlib with Python: E-commerce Data Visualization: EDUCBA
  • Data Analytics and Visualization with Tableau and more: Packt
  • Advanced Data Analysis & Visualization with Copilot in Excel: Microsoft
  • User Interface Design: University of Minnesota
  • Data Visualization using dplyr and ggplot2 in R: Coursera
  • Covid-19 Death Medical Analysis & Visualization using Plotly: Coursera
  • Data Visualization e manipolazione dei dati con Tableau: Università di Napoli Federico II
  • MAYA Architecture - Setting Up Interior Floor Map: EDUCBA

Other topics to explore

Arts and Humanities
338 courses
Business
1095 courses
Computer Science
668 courses
Data Science
425 courses
Information Technology
145 courses
Health
471 courses
Math and Logic
70 courses
Personal Development
137 courses
Physical Science and Engineering
413 courses
Social Sciences
401 courses
Language Learning
150 courses

Coursera Footer

Skills

  • Artificial Intelligence (AI)
  • Cybersecurity
  • Data Analytics
  • Digital Marketing
  • English Speaking
  • Generative AI (GenAI)
  • Microsoft Excel
  • Microsoft Power BI
  • Project Management
  • Python

Certificates & Programs

  • Google Cybersecurity Certificate
  • Google Data Analytics Certificate
  • Google IT Support Certificate
  • Google Project Management Certificate
  • Google UX Design Certificate
  • IBM Data Analyst Certificate
  • IBM Data Science Certificate
  • Machine Learning Certificate
  • Microsoft Power BI Data Analyst Certificate
  • UI / UX Design Certificate

Industries & Careers

  • Business
  • Computer Science
  • Data Science
  • Education & Teaching
  • Engineering
  • Finance
  • Healthcare
  • Human Resources (HR)
  • Information Technology (IT)
  • Marketing

Career Resources

  • Career Aptitude Test
  • Examples of Strengths and Weaknesses for Job Interviews
  • High-Income Skills to Learn
  • How Does Cryptocurrency Work?
  • How to Highlight Duplicates in Google Sheets
  • How to Learn Artificial Intelligence
  • Popular Cybersecurity Certifications
  • Preparing for the PMP Certification
  • Signs You Will Get the Job After an Interview
  • What Is Artificial Intelligence?

Coursera

  • About
  • What We Offer
  • Leadership
  • Careers
  • Catalog
  • Coursera Plus
  • Professional Certificates
  • MasterTrack® Certificates
  • Degrees
  • For Enterprise
  • For Government
  • For Campus
  • Become a Partner
  • Social Impact
  • Free Courses
  • Share your Coursera learning story

Community

  • Learners
  • Partners
  • Beta Testers
  • Blog
  • The Coursera Podcast
  • Tech Blog

More

  • Press
  • Investors
  • Terms
  • Privacy
  • Help
  • Accessibility
  • Contact
  • Articles
  • Directory
  • Affiliates
  • Modern Slavery Statement
  • Do Not Sell/Share
Learn Anywhere
Download on the App Store
Get it on Google Play
Logo of Certified B Corporation
© 2026 Coursera Inc. All rights reserved.
  • Coursera Facebook
  • Coursera Linkedin
  • Coursera Twitter
  • Coursera YouTube
  • Coursera Instagram
  • Coursera TikTok