• For Individuals
  • For Businesses
  • For Universities
  • For Governments
Log In
Join for Free
  • Browse
  • Create And Manage Helm Charts

Results for "create and manage helm charts"


  • Status: Free Trial
    Free Trial
    L

    LearnKartS

    Reports and Dashboards

    Skills you'll gain: Dashboard, Salesforce, Data Visualization, Salesforce Development, Ad Hoc Reporting, Business Reporting, Data Import/Export, End User Training and Support

    4.3
    Rating, 4.3 out of 5 stars
    ·
    13 reviews

    Intermediate · Course · 1 - 4 Weeks

  • C

    Coursera

    Use RACI charts for work management with Asana

    Skills you'll gain: Cross-Functional Collaboration, Project Management Software, Workflow Management, Organizational Skills, Project Management, Prioritization

    4.7
    Rating, 4.7 out of 5 stars
    ·
    16 reviews

    Beginner · Guided Project · Less Than 2 Hours

  • C

    Coursera

    Create an Organizational Company Chart with Canva

    Skills you'll gain: Marketing Design, Organizational Structure, Marketing Collateral, Graphic Design, Presentations, Dashboard, User Accounts

    4.8
    Rating, 4.8 out of 5 stars
    ·
    12 reviews

    Intermediate · Guided Project · Less Than 2 Hours

  • Status: Free Trial
    Free Trial
    J

    Johns Hopkins University

    Data Visualization in R with ggplot2

    Skills you'll gain: Ggplot2, Scatter Plots, Plot (Graphics), Data Visualization, Data Visualization Software, Heat Maps, R Programming, Graphical Tools, Data Wrangling, Tidyverse (R Package), Graphics Software

    4.9
    Rating, 4.9 out of 5 stars
    ·
    130 reviews

    Intermediate · Course · 1 - 4 Weeks

  • Status: Free Trial
    Free Trial
    S

    Splunk Inc.

    Splunk Knowledge Manager 103

    Skills you'll gain: Splunk, Interactive Data Visualization, Data Mapping, Performance Tuning, Geospatial Mapping, Wireframing, Extensible Markup Language (XML), Prototyping

    4.6
    Rating, 4.6 out of 5 stars
    ·
    10 reviews

    Intermediate · Course · 1 - 4 Weeks

  • C

    Coursera

    Create and manage a project dashboard with Wrike

    Skills you'll gain: Dashboard, Project Management Software, Data Import/Export, Workflow Management, Team Management, Project Coordination, Project Management, Project Planning

    4.9
    Rating, 4.9 out of 5 stars
    ·
    9 reviews

    Intermediate · Guided Project · Less Than 2 Hours

  • Status: Preview
    Preview
    N

    Northeastern University

    Designing Engaging Dashboards for Healthcare Analytics

    Skills you'll gain: Data Storytelling, Dashboard, Data Visualization, Data Presentation, Interactive Data Visualization, Infographics, Data Literacy, Tableau Software, Data Visualization Software, Presentations, Statistical Visualization, Storytelling, Design Elements And Principles, Data Analysis, Key Performance Indicators (KPIs), Health Informatics, Stakeholder Communications

    Mixed · Course · 1 - 4 Weeks

  • G

    Google Cloud

    Use Charts in Google Sheets

    Skills you'll gain: Data Visualization, Google Sheets, Data Visualization Software, Data Presentation, Pivot Tables And Charts, Spreadsheet Software, Google Workspace

    Advanced · Project · Less Than 2 Hours

  • C

    Coursera

    Data Visualization using Plotly

    Skills you'll gain: Plotly, Exploratory Data Analysis, Scatter Plots, Plot (Graphics), Data Visualization, Data Visualization Software, Interactive Data Visualization, Python Programming

    4
    Rating, 4 out of 5 stars
    ·
    50 reviews

    Intermediate · Guided Project · Less Than 2 Hours

  • C

    Coursera

    Presenting Data Using Charts with Canva

    Skills you'll gain: Presentations, Sales Presentations, Data Visualization, Productivity Software, Design

    4.3
    Rating, 4.3 out of 5 stars
    ·
    16 reviews

    Beginner · Guided Project · Less Than 2 Hours

  • Status: Free Trial
    Free Trial
    W

    Wesleyan University

    Data Management and Visualization

    Skills you'll gain: Descriptive Statistics, Data Manipulation, Data Presentation, Data Management, Data Literacy, Graphing, SAS (Software), Peer Review, Data Analysis, Statistics, Research Reports, Exploratory Data Analysis, Python Programming

    4.4
    Rating, 4.4 out of 5 stars
    ·
    943 reviews

    Mixed · Course · 1 - 3 Months

  • Status: Free
    Free
    C

    Coursera

    Tableau Public for Beginners: Data Visualization Basics

    Skills you'll gain: Dashboard, Interactive Data Visualization, Data Presentation, Tableau Software, Data Visualization Software, Data Analysis Software, Digital Publishing, Key Performance Indicators (KPIs), Data Import/Export

    3.8
    Rating, 3.8 out of 5 stars
    ·
    9 reviews

    Intermediate · Guided Project · Less Than 2 Hours

1…567…834

In summary, here are 10 of our most popular create and manage helm charts courses

  • Reports and Dashboards: LearnKartS
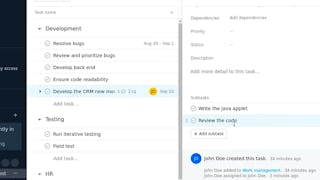
  • Use RACI charts for work management with Asana: Coursera
  • Create an Organizational Company Chart with Canva: Coursera
  • Data Visualization in R with ggplot2: Johns Hopkins University
  • Splunk Knowledge Manager 103: Splunk Inc.
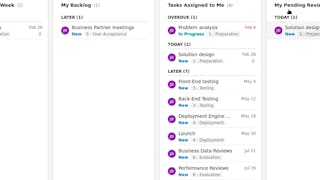
  • Create and manage a project dashboard with Wrike: Coursera
  • Designing Engaging Dashboards for Healthcare Analytics: Northeastern University
  • Use Charts in Google Sheets: Google Cloud
  • Data Visualization using Plotly: Coursera
  • Presenting Data Using Charts with Canva: Coursera

Other topics to explore

Arts and Humanities
338 courses
Business
1095 courses
Computer Science
668 courses
Data Science
425 courses
Information Technology
145 courses
Health
471 courses
Math and Logic
70 courses
Personal Development
137 courses
Physical Science and Engineering
413 courses
Social Sciences
401 courses
Language Learning
150 courses

Coursera Footer

Skills

  • Artificial Intelligence (AI)
  • Cybersecurity
  • Data Analytics
  • Digital Marketing
  • English Speaking
  • Generative AI (GenAI)
  • Microsoft Excel
  • Microsoft Power BI
  • Project Management
  • Python

Certificates & Programs

  • Google Cybersecurity Certificate
  • Google Data Analytics Certificate
  • Google IT Support Certificate
  • Google Project Management Certificate
  • Google UX Design Certificate
  • IBM Data Analyst Certificate
  • IBM Data Science Certificate
  • Machine Learning Certificate
  • Microsoft Power BI Data Analyst Certificate
  • UI / UX Design Certificate

Industries & Careers

  • Business
  • Computer Science
  • Data Science
  • Education & Teaching
  • Engineering
  • Finance
  • Healthcare
  • Human Resources (HR)
  • Information Technology (IT)
  • Marketing

Career Resources

  • Career Aptitude Test
  • Examples of Strengths and Weaknesses for Job Interviews
  • High-Income Skills to Learn
  • How Does Cryptocurrency Work?
  • How to Highlight Duplicates in Google Sheets
  • How to Learn Artificial Intelligence
  • Popular Cybersecurity Certifications
  • Preparing for the PMP Certification
  • Signs You Will Get the Job After an Interview
  • What Is Artificial Intelligence?

Coursera

  • About
  • What We Offer
  • Leadership
  • Careers
  • Catalog
  • Coursera Plus
  • Professional Certificates
  • MasterTrack® Certificates
  • Degrees
  • For Enterprise
  • For Government
  • For Campus
  • Become a Partner
  • Social Impact
  • Free Courses
  • Share your Coursera learning story

Community

  • Learners
  • Partners
  • Beta Testers
  • Blog
  • The Coursera Podcast
  • Tech Blog

More

  • Press
  • Investors
  • Terms
  • Privacy
  • Help
  • Accessibility
  • Contact
  • Articles
  • Directory
  • Affiliates
  • Modern Slavery Statement
  • Do Not Sell/Share
Learn Anywhere
Download on the App Store
Get it on Google Play
Logo of Certified B Corporation
© 2025 Coursera Inc. All rights reserved.
  • Coursera Facebook
  • Coursera Linkedin
  • Coursera Twitter
  • Coursera YouTube
  • Coursera Instagram
  • Coursera TikTok