Results for "visualization chart"
 Status: Free Trial
Skills you'll gain: Data Analysis Expressions (DAX), Power BI, Pivot Tables And Charts, Microsoft Excel, R Programming, Alteryx, Dashboard, Statistical Programming, Data Transformation, Tableau Software, Data Cleansing, Data Presentation, Data Visualization Software, Interactive Data Visualization, Debugging, Data Visualization, Automation, Python Programming, Data Structures, Statistical Analysis
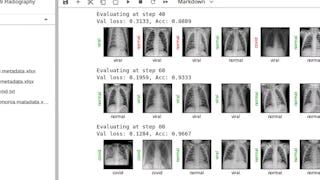
Skills you'll gain: PyTorch (Machine Learning Library), Convolutional Neural Networks, Transfer Learning, Image Analysis, Deep Learning, Model Evaluation, Medical Imaging, Computer Vision, Machine Learning, Data Preprocessing
 Status: Preview
University of Michigan
Skills you'll gain: Data Wrangling, Analytical Skills, Data Analysis, Data Preprocessing, Data Cleansing, Generative AI, ChatGPT, Data Visualization Software, Jupyter, Statistical Analysis, Artificial Intelligence, Data Collection, Data Management, GitHub, Technical Support, Git (Version Control System), Integrated Development Environments
 Status: Free Trial
Vanderbilt University
Skills you'll gain: Large Language Modeling, Project Planning, ChatGPT, Risk Analysis, Timelines, Project Risk Management, Performance Metric, Project Schedules, Project Management, Prompt Engineering, Key Performance Indicators (KPIs), Smart Goals, Work Breakdown Structure, Generative AI, Analysis
 Status: Free Trial
Skills you'll gain: Relational Databases, Data Visualization, Data Modeling, Cloud Security, Databases, Database Management, Data Analysis Expressions (DAX), Advanced Analytics, Data Management, Data Governance, Data Preprocessing, Microsoft Excel, Amazon Web Services, Data Integration, Data Security, Cost Control, Cloud Computing, Spreadsheet Software, Excel Formulas, Predictive Modeling
 Status: Free Trial
Skills you'll gain: Interactive Data Visualization, Business Intelligence, Data Presentation, Infographics, Data Visualization, Dashboard, Generative AI, Data Ethics, Responsible AI, Artificial Intelligence, Artificial Intelligence and Machine Learning (AI/ML), SQL, Data Analysis, Presentations, Natural Language Processing
 Status: Free Trial
Johns Hopkins University
Skills you'll gain: Tidyverse (R Package), Data Wrangling, R (Software), Data Cleansing, Data Transformation, Data Manipulation, R Programming, Data Science, Exploratory Data Analysis, Data Analysis, Data Management, File Management, Data Visualization, Data Import/Export
 Status: NewStatus: Free Trial
Skills you'll gain: Programmable Logic Controllers, Animations, Human Machine Interfaces, Control Systems, Real-Time Operating Systems, Visualization (Computer Graphics), Control Panels, Test Tools, Interactive Design, Automation Engineering, Program Development, Automation, Simulations, System Monitoring, Electrical Wiring, Computational Logic, Simulation and Simulation Software, User Interface (UI) Design, Network Troubleshooting, User Feedback
 Status: Free Trial
Macquarie University
Skills you'll gain: Forecasting, Regression Analysis, Time Series Analysis and Forecasting, Business Mathematics, Model Evaluation, Microsoft Excel, Statistical Modeling, Trend Analysis, Statistical Analysis, Data Presentation, Data Visualization Software, Data Manipulation
 Status: NewStatus: Preview
Skills you'll gain: Lean Six Sigma, Lean Methodologies, Six Sigma Methodology, Quality Improvement, Process Improvement, Process Analysis, Operational Efficiency, Continuous Improvement Process, Root Cause Analysis, Waste Minimization, Pareto Chart, Standard Operating Procedure

Skills you'll gain: Microsoft Excel, Dashboard, Pivot Tables And Charts, Spreadsheet Software, Data Visualization Software, Data Presentation, Data Analysis
 Status: Free Trial
LearnQuest
Skills you'll gain: Image Analysis, Exploratory Data Analysis, Time Series Analysis and Forecasting, Data Wrangling, Model Evaluation, Data Preprocessing, Operations Research, NumPy, Data Manipulation, Feature Engineering, Supervised Learning, Inventory Management System, Supply Chain, Applied Machine Learning, Trend Analysis, Data Visualization, Customer Demand Planning, Machine Learning, Data Science, Data Analysis
In summary, here are 10 of our most popular visualization chart courses
- Data Analysts' Toolbox - Excel, Power BI, Python, & Tableau: Packt
- Detecting COVID-19 with Chest X-Ray using PyTorch: Coursera
- AI-Powered Data Analysis: A Practical Introduction: University of Michigan
- ChatGPT for Project Management: Insight, Planning, & Success: Vanderbilt University
- Mastering Power BI for Data Analytics & Storytelling: Edureka
- Generative AI: Elevate your Business Intelligence Career: SkillUp
- Introduction to the Tidyverse: Johns Hopkins University
- Learn PLC and HMI from Scratch (Basic): Packt
- Excel Regression Models for Business Forecasting: Macquarie University
- Lean Six Sigma White Belt: Analyze & Improve: EDUCBA


