• For Individuals
  • For Businesses
  • For Universities
  • For Governments
Degrees
Log In
Join for Free
  • Browse
  • Tidyverse R Package

Results for "tidyverse+(r+package)"


  • Status: New
    New
    Status: Preview
    Preview
    M

    Microsoft

    Boost R Coding with GitHub Copilot

    Skills you'll gain: Microsoft Copilot, Version Control, Collaborative Software, GitHub, Microsoft Visual Studio, Software Documentation, AI Workflows, R Programming, Git (Version Control System), Computer Programming Tools, Debugging

    Beginner · Course · 1 - 4 Weeks

  • C

    Coursera

    Data Visualization using dplyr and ggplot2 in R

    Skills you'll gain: Ggplot2, Tidyverse (R Package), Data Visualization, Data Analysis, Exploratory Data Analysis, R Programming, Data Visualization Software, Data Manipulation, R (Software)

    5
    Rating, 5 out of 5 stars
    ·
    20 reviews

    Intermediate · Guided Project · Less Than 2 Hours

  • C

    Coursera

    Using probability distributions for real world problems in R

    Skills you'll gain: Statistical Inference, Probability Distribution, R Programming, Statistical Visualization, Statistics, Data Visualization, Statistical Analysis, Statistical Modeling, Statistical Hypothesis Testing, Data Analysis, Probability

    4.8
    Rating, 4.8 out of 5 stars
    ·
    32 reviews

    Beginner · Guided Project · Less Than 2 Hours

  • C

    Coursera

    Joining Data in R using dplyr

    Skills you'll gain: Data Cleansing, Data Manipulation, Data Integration, R Programming, Data Preprocessing, Tidyverse (R Package), Data Management

    Intermediate · Guided Project · Less Than 2 Hours

  • Status: Preview
    Preview
    U

    University of Michigan

    파이썬의 데이터 과학 소개

    Skills you'll gain: Pandas (Python Package), NumPy, Data Manipulation, Statistical Analysis, Jupyter, Data Structures, Data Cleansing, Pivot Tables And Charts, Data Analysis, Data Preprocessing, Exploratory Data Analysis, Python Programming, Probability & Statistics, Data Import/Export

    Intermediate · Course · 1 - 4 Weeks

  • Status: Preview
    Preview
    J

    Johns Hopkins University

    데이터 과학자의 도구 상자

    Skills you'll gain: Rmarkdown, Data Science, R (Software), GitHub, Version Control, Data Analysis, Big Data, R Programming, Git (Version Control System), Statistical Programming, Data Quality, Data Management, Technical Communication

    4.7
    Rating, 4.7 out of 5 stars
    ·
    9 reviews

    Mixed · Course · 1 - 4 Weeks

  • P

    Packt

    How to Visualize Data with R

    Skills you'll gain: Data Visualization Software, Data Visualization, Statistical Visualization, Ggplot2, Plot (Graphics), R Programming, Scatter Plots, Data Collection, Data Analysis, Data Manipulation, Data Import/Export, Regression Analysis, Data Preprocessing, Software Installation

    Intermediate · Course · 1 - 4 Weeks

  • Status: New
    New
    P

    Packt

    Data Representation and Serialization

    Skills you'll gain: Interoperability, Data Transformation, Secure Coding, Python Programming

    Intermediate · Course · 1 - 4 Weeks

  • C

    Coursera

    Building Statistical Models in R: Linear Regression

    Skills you'll gain: Exploratory Data Analysis, Statistical Modeling, Regression Analysis, Data Visualization, Model Evaluation, Data Analysis, Statistical Methods, Scatter Plots, R Programming, Statistical Analysis, Plot (Graphics), R (Software), Ggplot2

    4.7
    Rating, 4.7 out of 5 stars
    ·
    20 reviews

    Beginner · Guided Project · Less Than 2 Hours

  • C

    Coursera

    Using Descriptive Statistics to Analyze Data in R

    Skills you'll gain: Descriptive Statistics, R Programming, Statistical Reporting, Data Quality, Data Preprocessing, Statistics, Statistical Methods, Data Manipulation, Data Analysis Software, Data Import/Export

    4.6
    Rating, 4.6 out of 5 stars
    ·
    93 reviews

    Beginner · Guided Project · Less Than 2 Hours

  • Status: Free Trial
    Free Trial
    U

    University of Michigan

    Exploratory Data Analysis for the Public Sector with ggplot

    Skills you'll gain: Data Visualization, Exploratory Data Analysis, Plot (Graphics), Data Presentation, Ggplot2, R (Software), Statistical Visualization, R Programming, Data Visualization Software, Data Analysis, Scatter Plots, Graphic and Visual Design, Histogram, Tidyverse (R Package), Public Administration, Trend Analysis, Policy Analysis

    5
    Rating, 5 out of 5 stars
    ·
    11 reviews

    Intermediate · Course · 1 - 4 Weeks

  • C

    Coursera

    R أساسيات لغة البرمجة

    Skills you'll gain: Exploratory Data Analysis, R Programming, Data Manipulation, Statistical Programming, Data Analysis, File Management, Integrated Development Environments, Programming Principles, Data Science, Data Structures, Computer Programming

    Beginner · Guided Project · Less Than 2 Hours

1…6789

In summary, here are 10 of our most popular tidyverse+(r+package) courses

  • Boost R Coding with GitHub Copilot: Microsoft
  • Data Visualization using dplyr and ggplot2 in R: Coursera
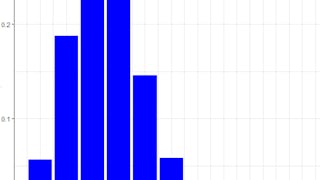
  • Using probability distributions for real world problems in R: Coursera
  • Joining Data in R using dplyr: Coursera
  • 파이썬의 데이터 과학 소개: University of Michigan
  • 데이터 과학자의 도구 상자: Johns Hopkins University
  • How to Visualize Data with R: Packt
  • Data Representation and Serialization: Packt
  • Building Statistical Models in R: Linear Regression: Coursera
  • Using Descriptive Statistics to Analyze Data in R: Coursera

Other topics to explore

Arts and Humanities
338 courses
Business
1095 courses
Computer Science
668 courses
Data Science
425 courses
Information Technology
145 courses
Health
471 courses
Math and Logic
70 courses
Personal Development
137 courses
Physical Science and Engineering
413 courses
Social Sciences
401 courses
Language Learning
150 courses

Coursera Footer

Skills

  • Artificial Intelligence (AI)
  • Cybersecurity
  • Data Analytics
  • Digital Marketing
  • English Speaking
  • Generative AI (GenAI)
  • Microsoft Excel
  • Microsoft Power BI
  • Project Management
  • Python

Certificates & Programs

  • Google Cybersecurity Certificate
  • Google Data Analytics Certificate
  • Google IT Support Certificate
  • Google Project Management Certificate
  • Google UX Design Certificate
  • IBM Data Analyst Certificate
  • IBM Data Science Certificate
  • Machine Learning Certificate
  • Microsoft Power BI Data Analyst Certificate
  • UI / UX Design Certificate

Industries & Careers

  • Business
  • Computer Science
  • Data Science
  • Education & Teaching
  • Engineering
  • Finance
  • Healthcare
  • Human Resources (HR)
  • Information Technology (IT)
  • Marketing

Career Resources

  • Career Aptitude Test
  • Examples of Strengths and Weaknesses for Job Interviews
  • High-Income Skills to Learn
  • How Does Cryptocurrency Work?
  • How to Highlight Duplicates in Google Sheets
  • How to Learn Artificial Intelligence
  • Popular Cybersecurity Certifications
  • Preparing for the PMP Certification
  • Signs You Will Get the Job After an Interview
  • What Is Artificial Intelligence?

Coursera

  • About
  • What We Offer
  • Leadership
  • Careers
  • Catalog
  • Coursera Plus
  • Professional Certificates
  • MasterTrack® Certificates
  • Degrees
  • For Enterprise
  • For Government
  • For Campus
  • Become a Partner
  • Social Impact
  • Free Courses
  • Share your Coursera learning story

Community

  • Learners
  • Partners
  • Beta Testers
  • Blog
  • The Coursera Podcast
  • Tech Blog

More

  • Press
  • Investors
  • Terms
  • Privacy
  • Help
  • Accessibility
  • Contact
  • Articles
  • Directory
  • Affiliates
  • Modern Slavery Statement
  • Do Not Sell/Share
Learn Anywhere
Download on the App Store
Get it on Google Play
Logo of Certified B Corporation
© 2025 Coursera Inc. All rights reserved.
  • Coursera Facebook
  • Coursera Linkedin
  • Coursera Twitter
  • Coursera YouTube
  • Coursera Instagram
  • Coursera TikTok