• For Individuals
  • For Businesses
  • For Universities
  • For Governments
Coursera
  • Online Degrees
  • Careers
  • Log In
  • Join for Free
    Coursera
    • Browse
    • Reporting With Graphs
    Skip to search results

    Filter by

    Subject
    Required
     *

    Language
    Required
     *

    The language used throughout the course, in both instruction and assessments.

    Learning Product
    Required
     *

    Level
    Required
     *

    Duration
    Required
     *

    Skills
    Required
     *

    Subtitles
    Required
     *

    Educator
    Required
     *

    Results for "reporting with graphs"

    • Status: Free Trial
      Free Trial
      U

      University of Colorado Boulder

      Data Understanding and Visualization

      Skills you'll gain: Matplotlib, Seaborn, Data Visualization, Data-Driven Decision-Making, Exploratory Data Analysis, Data Presentation, Plot (Graphics), Data Visualization Software, Descriptive Statistics, Data Storytelling, Pandas (Python Package), Statistical Methods, Data Analysis, Statistics, Statistical Analysis, Data Manipulation, Box Plots, Scatter Plots, Correlation Analysis, Python Programming

      4.9
      Rating, 4.9 out of 5 stars
      ·
      7 reviews

      Intermediate · Course · 1 - 4 Weeks

    • C

      Coursera Project Network

      Python for Data Visualization:Matplotlib & Seaborn(Enhanced)

      Skills you'll gain: Matplotlib, Seaborn, Plot (Graphics), Scatter Plots, Histogram, Data Visualization, Data Visualization Software, Statistical Visualization, Data Analysis, Python Programming

      4.5
      Rating, 4.5 out of 5 stars
      ·
      28 reviews

      Beginner · Guided Project · Less Than 2 Hours

    • P

      Packt

      AI Enhancement with Knowledge Graphs - Mastering RAG Systems

      Skills you'll gain: Large Language Modeling, Graph Theory, Artificial Intelligence and Machine Learning (AI/ML), Generative AI, Query Languages, Data Visualization Software, Unstructured Data, Database Management Systems, Development Environment

      Intermediate · Course · 1 - 3 Months

    • C

      Coursera Project Network

      Crash Course on Interactive Data Visualization with Plotly

      Skills you'll gain: Plotly, Histogram, Interactive Data Visualization, Scatter Plots, Plot (Graphics), Data Visualization, Data Analysis, Python Programming

      4.8
      Rating, 4.8 out of 5 stars
      ·
      10 reviews

      Beginner · Guided Project · Less Than 2 Hours

    • C

      Coursera Project Network

      Using Descriptive Statistics to Analyze Data in R

      Skills you'll gain: Descriptive Statistics, R Programming, Statistical Reporting, Data Quality, Data Cleansing, Statistics, Statistical Methods, Data Manipulation, Data Import/Export

      4.6
      Rating, 4.6 out of 5 stars
      ·
      93 reviews

      Beginner · Guided Project · Less Than 2 Hours

    • Status: Free
      Free
      D

      DeepLearning.AI

      Knowledge Graphs for RAG

      Skills you'll gain: Large Language Modeling, Query Languages, Data Storage Technologies, Data Storage, Semantic Web, Unstructured Data, Graph Theory, Text Mining

      4.7
      Rating, 4.7 out of 5 stars
      ·
      81 reviews

      Intermediate · Project · Less Than 2 Hours

    • Status: Free Trial
      Free Trial
      U

      University of Colorado Boulder

      Financial Forecasting and Reporting

      Skills you'll gain: Sustainability Reporting, Financial Analysis, Financial Statement Analysis, Environmental Social And Corporate Governance (ESG), Budgeting, Cost Benefit Analysis, Risk Management, Income Statement, Cost Estimation, Balance Sheet, Return On Investment, Financial Reporting, Financial Forecasting, Cash Flows, Financial Market

      Build toward a degree

      4.8
      Rating, 4.8 out of 5 stars
      ·
      72 reviews

      Intermediate · Course · 1 - 3 Months

    • Status: Free
      Free
      C

      Coursera Project Network

      Dynamic Dashboards with Tableau: Advanced Sales Analysis

      Skills you'll gain: Dashboard, Data Visualization, Interactive Data Visualization, Data Presentation, Tableau Software, Data Visualization Software, Exploratory Data Analysis, Business Intelligence, Data Analysis

      Intermediate · Guided Project · Less Than 2 Hours

    • C

      Coursera Project Network

      Covid-19 Death Medical Analysis & Visualization using Plotly

      Skills you'll gain: Plotly, Data Visualization, Datamaps, Data Visualization Software, Scatter Plots, Jupyter, Python Programming, Exploratory Data Analysis, Pandas (Python Package), Data Analysis, Medical Science and Research

      4.2
      Rating, 4.2 out of 5 stars
      ·
      13 reviews

      Beginner · Guided Project · Less Than 2 Hours

    • Status: Free Trial
      Free Trial
      U

      University of Colorado Boulder

      Trees and Graphs: Basics

      Skills you'll gain: Graph Theory, Data Structures, Algorithms, Tree Maps, Theoretical Computer Science, Network Analysis, Computational Thinking, Probability & Statistics, Python Programming

      Build toward a degree

      4.6
      Rating, 4.6 out of 5 stars
      ·
      172 reviews

      Advanced · Course · 1 - 4 Weeks

    • C

      Coursera Project Network

      Plots Creation using Matplotlib Python

      Skills you'll gain: Matplotlib, Box Plots, Plot (Graphics), Seaborn, Data Visualization, Data Visualization Software, Pandas (Python Package), Scatter Plots, Data Presentation, Data Import/Export, Histogram, Python Programming, Data Manipulation, Data Analysis, Data Structures

      3.9
      Rating, 3.9 out of 5 stars
      ·
      9 reviews

      Beginner · Guided Project · Less Than 2 Hours

    • Status: Free
      Free
      C

      Coursera Project Network

      Multi-Table data analysis with Tableau: Customer Analysis

      Skills you'll gain: Dashboard, Interactive Data Visualization, Tableau Software, Data Presentation, Data Import/Export, Data Visualization, Data Visualization Software, Business Intelligence, Data Analysis, Data Integration, Data Modeling

      Intermediate · Guided Project · Less Than 2 Hours

    1…8910…834

    In summary, here are 10 of our most popular reporting with graphs courses

    • Data Understanding and Visualization: University of Colorado Boulder
    • Python for Data Visualization:Matplotlib & Seaborn(Enhanced): Coursera Project Network
    • AI Enhancement with Knowledge Graphs - Mastering RAG Systems: Packt
    • Crash Course on Interactive Data Visualization with Plotly: Coursera Project Network
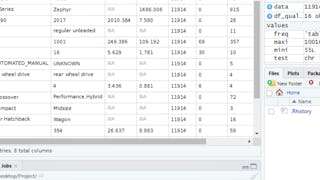
    • Using Descriptive Statistics to Analyze Data in R: Coursera Project Network
    • Knowledge Graphs for RAG: DeepLearning.AI
    • Financial Forecasting and Reporting: University of Colorado Boulder
    • Dynamic Dashboards with Tableau: Advanced Sales Analysis: Coursera Project Network
    • Covid-19 Death Medical Analysis & Visualization using Plotly: Coursera Project Network
    • Trees and Graphs: Basics: University of Colorado Boulder

    Other topics to explore

    Arts and Humanities
    338 courses
    Business
    1095 courses
    Computer Science
    668 courses
    Data Science
    425 courses
    Information Technology
    145 courses
    Health
    471 courses
    Math and Logic
    70 courses
    Personal Development
    137 courses
    Physical Science and Engineering
    413 courses
    Social Sciences
    401 courses
    Language Learning
    150 courses

    Coursera Footer

    Technical Skills

    • ChatGPT
    • Coding
    • Computer Science
    • Cybersecurity
    • DevOps
    • Ethical Hacking
    • Generative AI
    • Java Programming
    • Python
    • Web Development

    Analytical Skills

    • Artificial Intelligence
    • Big Data
    • Business Analysis
    • Data Analytics
    • Data Science
    • Financial Modeling
    • Machine Learning
    • Microsoft Excel
    • Microsoft Power BI
    • SQL

    Business Skills

    • Accounting
    • Digital Marketing
    • E-commerce
    • Finance
    • Google
    • Graphic Design
    • IBM
    • Marketing
    • Project Management
    • Social Media Marketing

    Career Resources

    • Essential IT Certifications
    • High-Income Skills to Learn
    • How to Get a PMP Certification
    • How to Learn Artificial Intelligence
    • Popular Cybersecurity Certifications
    • Popular Data Analytics Certifications
    • What Does a Data Analyst Do?
    • Career Development Resources
    • Career Aptitude Test
    • Share your Coursera Learning Story

    Coursera

    • About
    • What We Offer
    • Leadership
    • Careers
    • Catalog
    • Coursera Plus
    • Professional Certificates
    • MasterTrack® Certificates
    • Degrees
    • For Enterprise
    • For Government
    • For Campus
    • Become a Partner
    • Social Impact
    • Free Courses
    • ECTS Credit Recommendations

    Community

    • Learners
    • Partners
    • Beta Testers
    • Blog
    • The Coursera Podcast
    • Tech Blog

    More

    • Press
    • Investors
    • Terms
    • Privacy
    • Help
    • Accessibility
    • Contact
    • Articles
    • Directory
    • Affiliates
    • Modern Slavery Statement
    • Do Not Sell/Share
    Learn Anywhere
    Download on the App Store
    Get it on Google Play
    Logo of Certified B Corporation
    © 2025 Coursera Inc. All rights reserved.
    • Coursera Facebook
    • Coursera Linkedin
    • Coursera Twitter
    • Coursera YouTube
    • Coursera Instagram
    • Coursera TikTok