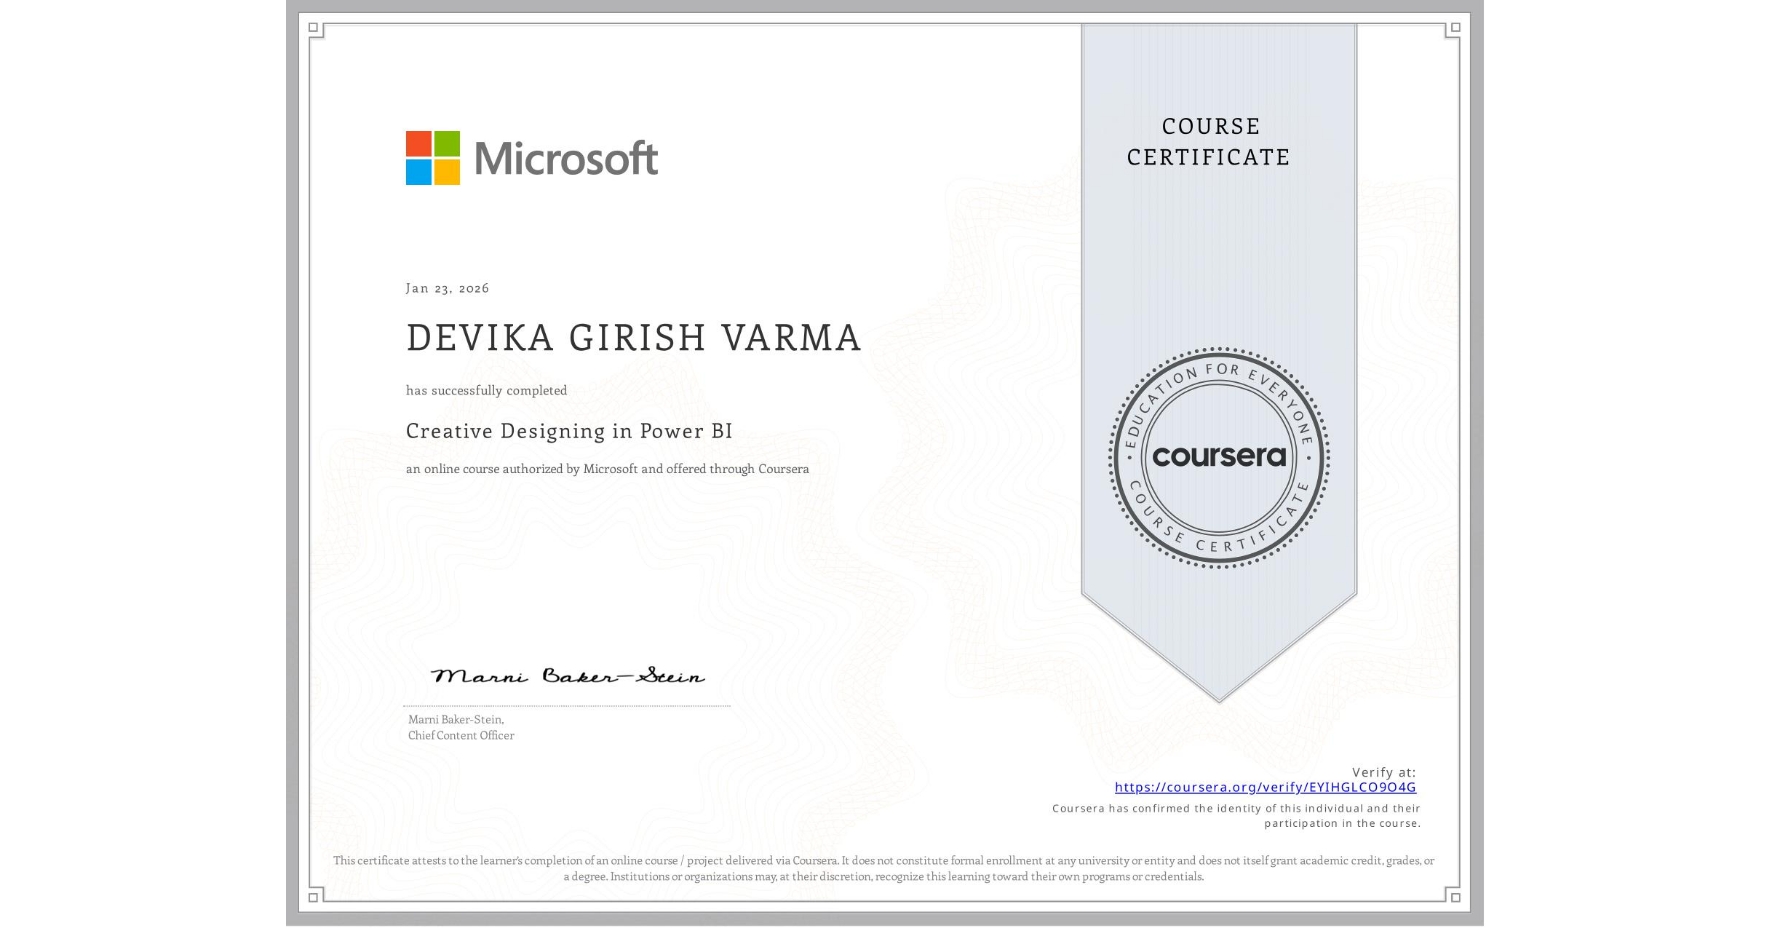
Creative Designing in Power BI
Completed by DEVIKA GIRISH VARMA
January 23, 2026
19 hours (approximately)
DEVIKA GIRISH VARMA's account is verified. Coursera certifies their successful completion of Creative Designing in Power BI

What you will learn
How to create compelling and cohesive reports and dashboards.
How to work in detail with specialist chart visualizations.
How to add elements such as videos, streaming data and QR codes to dashboards.
Skills you will gain
- Category: Dashboard Creation
- Category: Data Visualization
- Category: Data Presentation
- Category: Datamaps
- Category: Creative Design
- Category: Geospatial Mapping
- Category: Data Analysis
- Category: Power BI
- Category: Dashboard
- Category: Data Visualization Software
- Category: Data Storytelling
- Category: Design