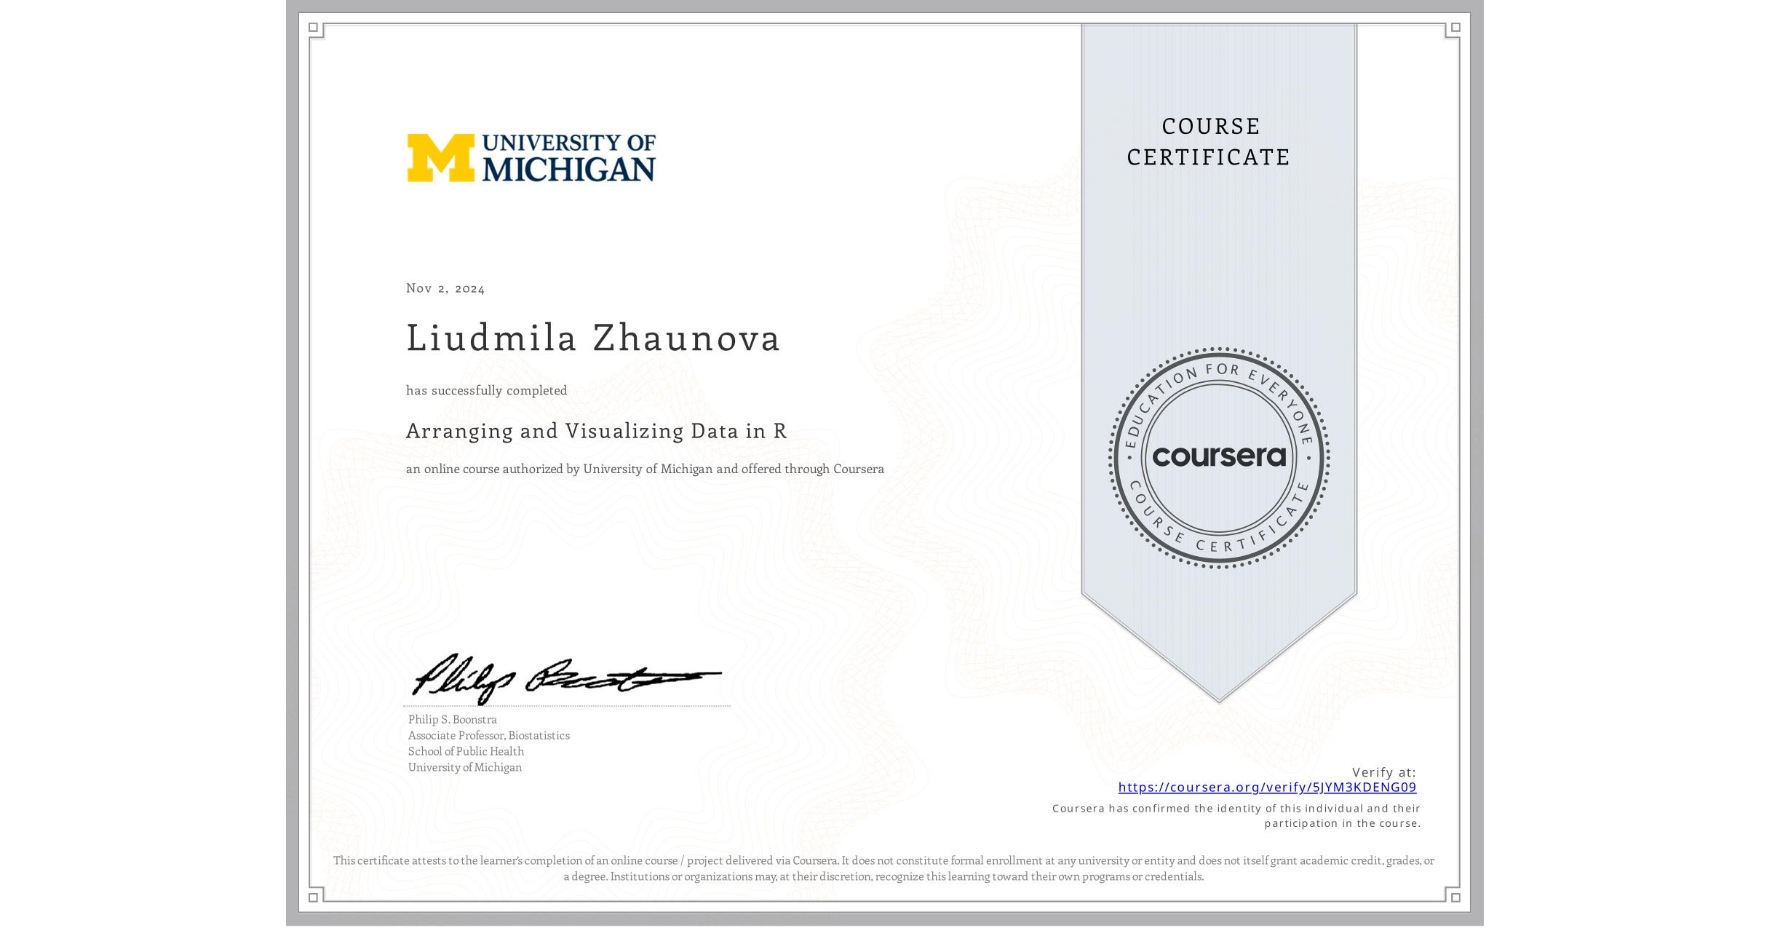
Arranging and Visualizing Data in R
Completed by Liudmila Zhaunova
November 2, 2024
18 hours (approximately)
Liudmila Zhaunova's account is verified. Coursera certifies their successful completion of Arranging and Visualizing Data in R

What you will learn
Become knowledgeable about and conversant in the R environment
Format and manipulate data within R into suitable formats
Develop an intuition for doing exploratory data analysis
Develop a workflow in R
Skills you will gain
- Category: Package and Software Management
- Category: Data Manipulation
- Category: Statistical Visualization
- Category: Data Visualization
- Category: R Programming
- Category: Data Transformation
- Category: Data Wrangling
- Category: Tidyverse (R Package)
- Category: Plot (Graphics)
- Category: Histogram
- Category: R (Software)
- Category: Statistical Reporting