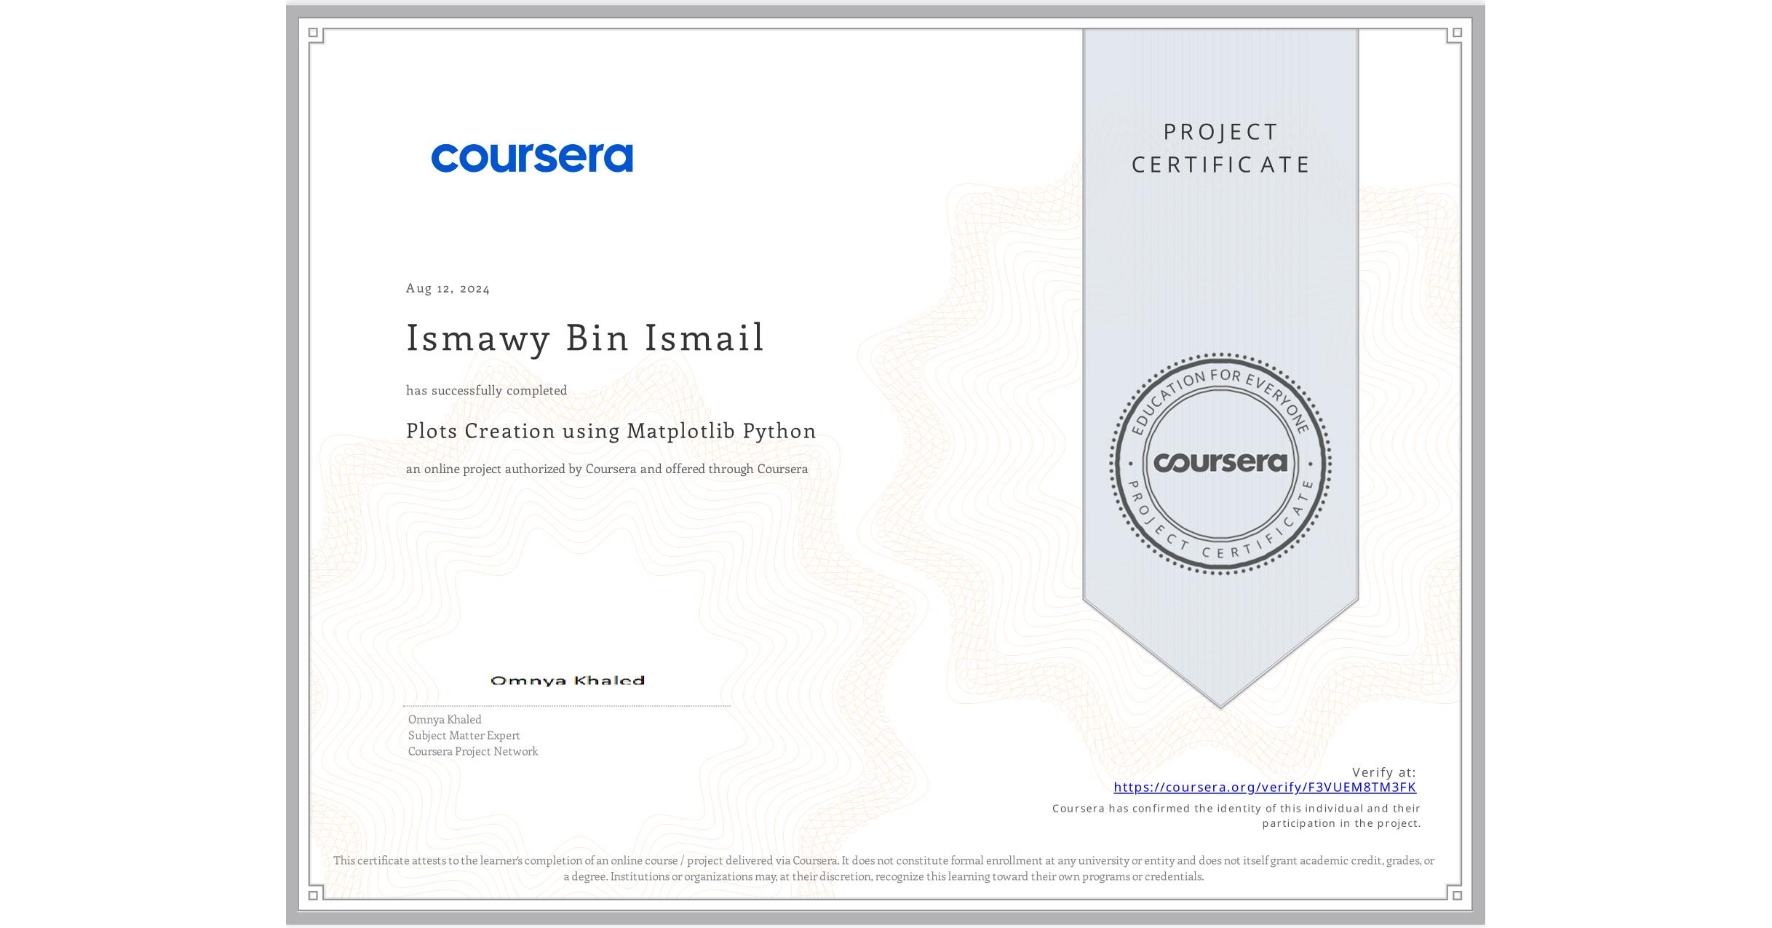
Plots Creation using Matplotlib Python
Completed by Ismawy Bin Ismail
August 11, 2024
1 hours (approximately)
Ismawy Bin Ismail's account is verified. Coursera certifies their successful completion of Plots Creation using Matplotlib Python

What you will learn
Add the data in the CSV file to Pandas data frame, plot the graph and set marker type and color.
Create the boxplot, set labels, change font size, add grid lines and legends, and finally save the graph as an image.
Skills you will gain
- Category: Data Manipulation
- Category: Seaborn
- Category: Scatter Plots
- Category: Data Structures
- Category: Plot (Graphics)
- Category: Histogram
- Category: Pandas (Python Package)
- Category: Data Presentation
- Category: Statistical Visualization
- Category: Python Programming
- Category: Data Import/Export
- Category: Data Visualization