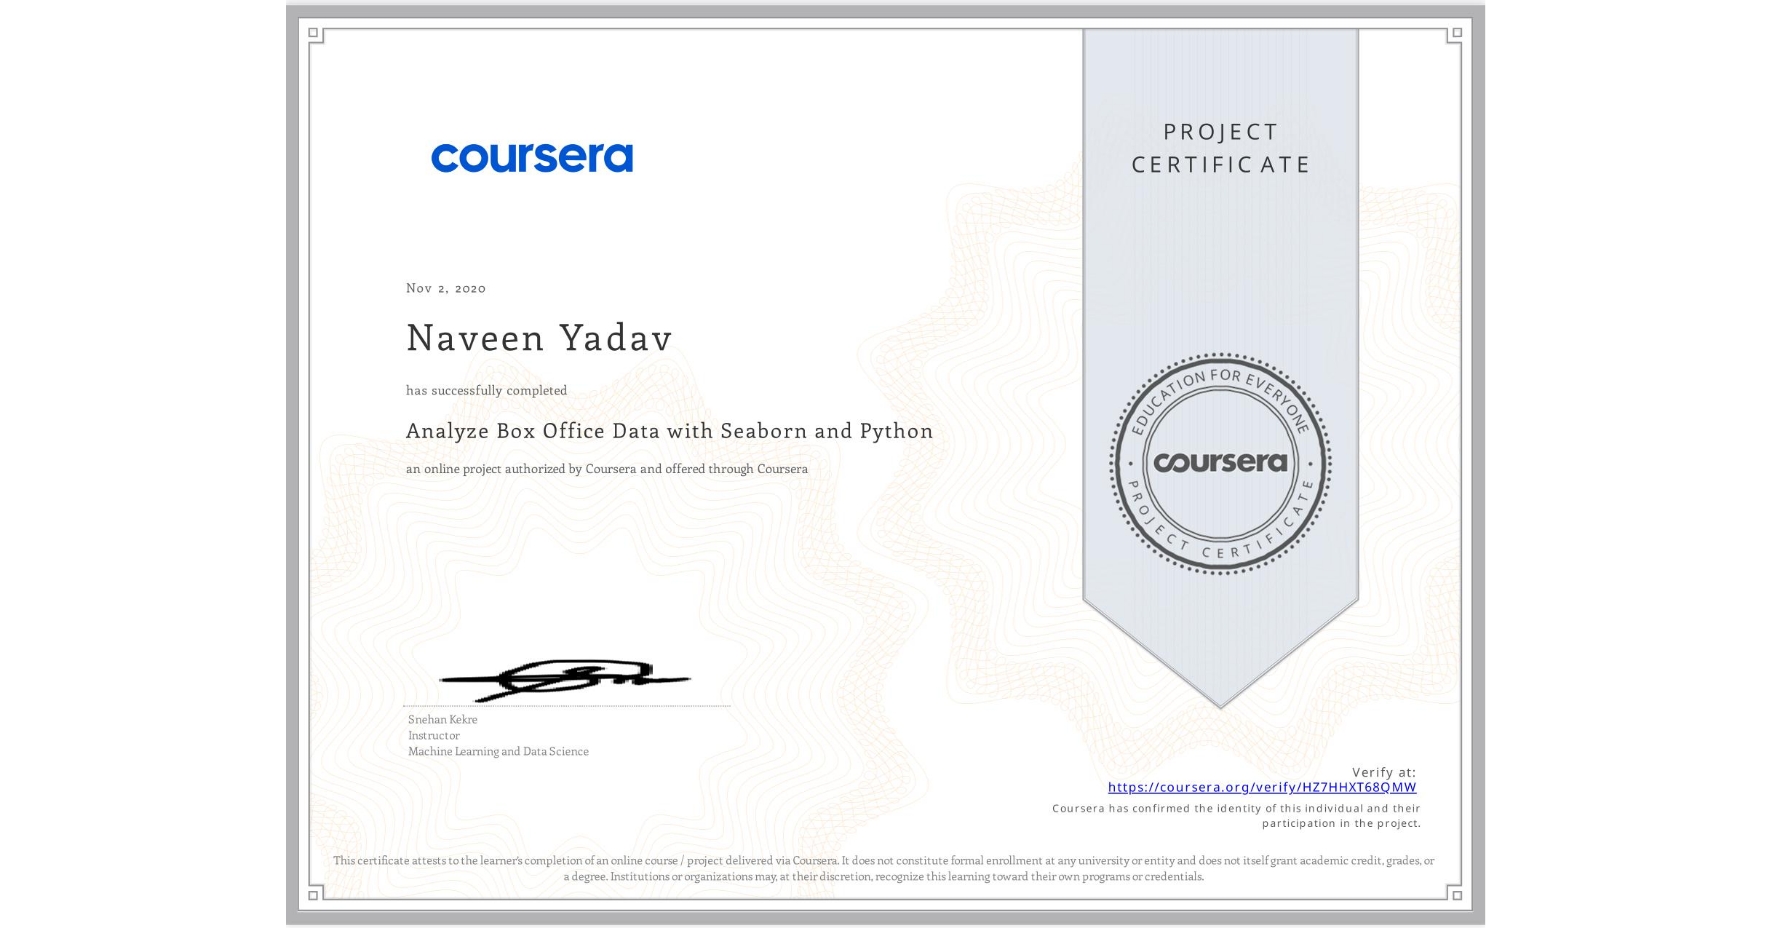
Analyze Box Office Data with Seaborn and Python
Completed by Naveen Yadav
November 2, 2020
1 hours (approximately)
Naveen Yadav's account is verified. Coursera certifies their successful completion of Analyze Box Office Data with Seaborn and Python

What you will learn
Produce data visualizations with Seaborn
Apply graphical techniques used in exploratory data analysis (EDA)
Skills you will gain
- Category: Predictive Modeling
- Category: Seaborn
- Category: Computing Platforms
- Category: Data Science
- Category: Python Programming
- Category: Plotly
- Category: Data Visualization Software
- Category: Jupyter
- Category: Data Visualization
- Category: Exploratory Data Analysis
- Category: Data Analysis
- Category: Interactive Data Visualization