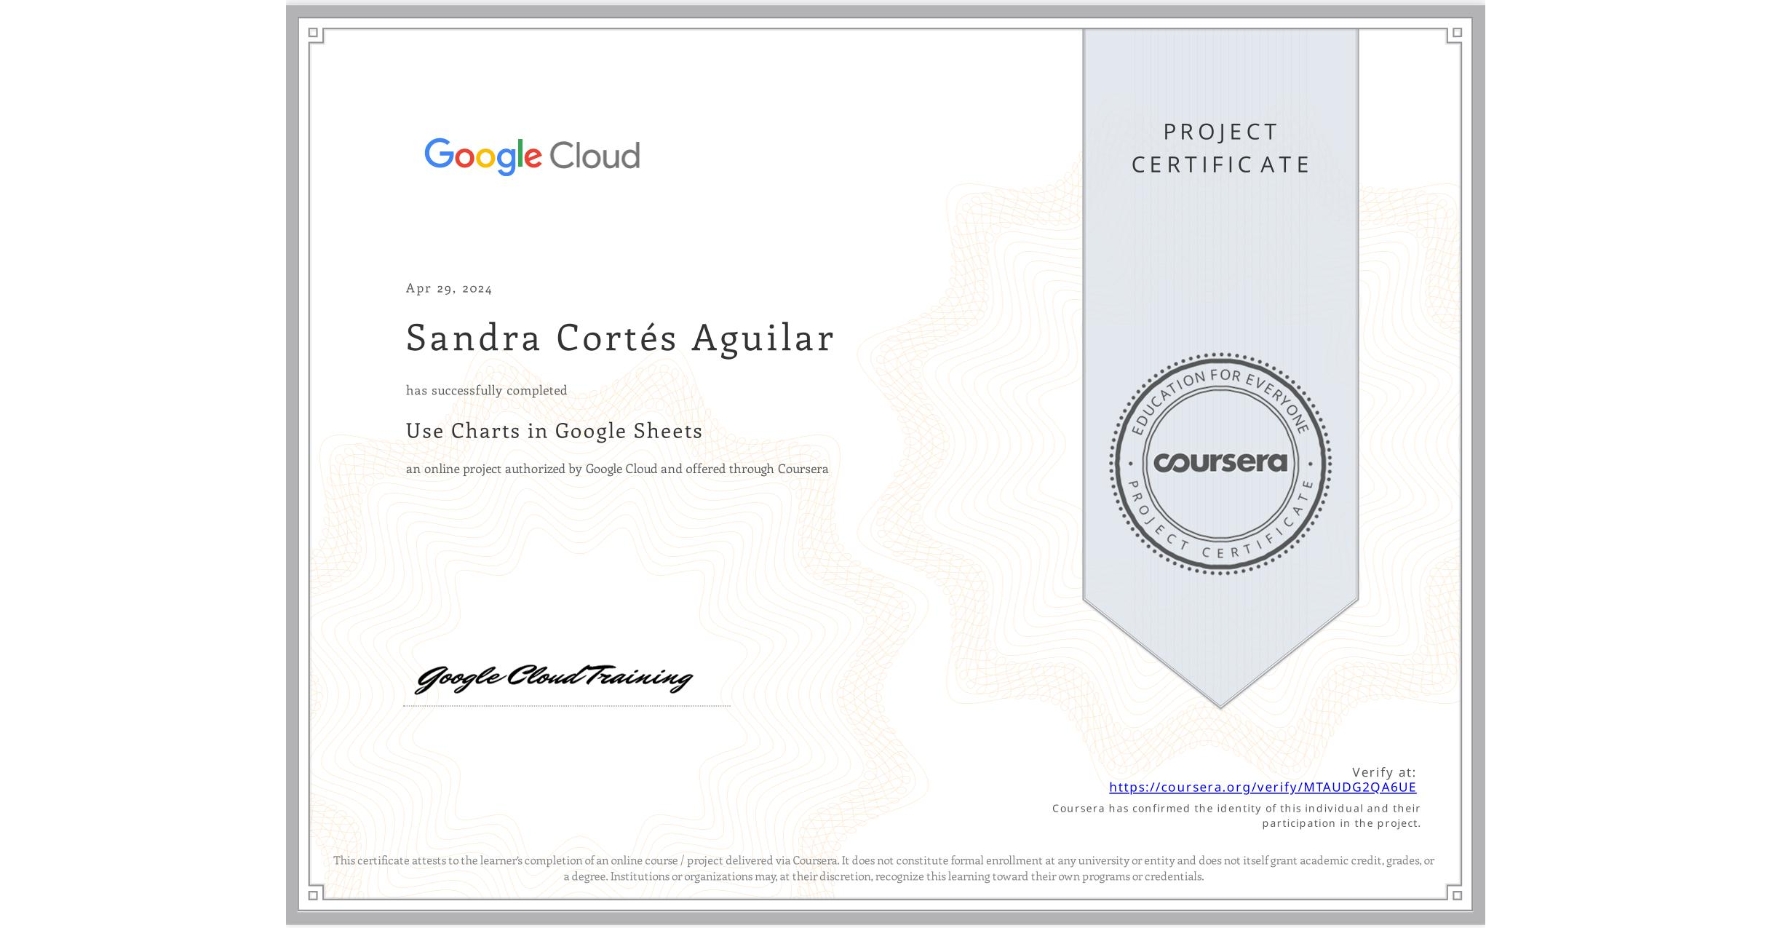
Use Charts in Google Sheets
Completed by Sandra Cortés Aguilar
April 28, 2024
hours (approximately)
Sandra Cortés Aguilar's account is verified. Coursera certifies their successful completion of Use Charts in Google Sheets

What you will learn
Visualize datasets using pie charts, column charts, line charts, combo charts, and scatter charts.
Customize charts using the chart editor.
Create inline visualizations using sparklines and progress bars.
Use charts and tables in other Google Workspace products and publish charts in Sheets.
Skills you will gain
- Category: Google Workspace
- Category: Data Presentation
- Category: Spreadsheet Software
- Category: Data Visualization
- Category: Google Sheets
- Category: Pivot Tables And Charts
- Category: Data Visualization Software