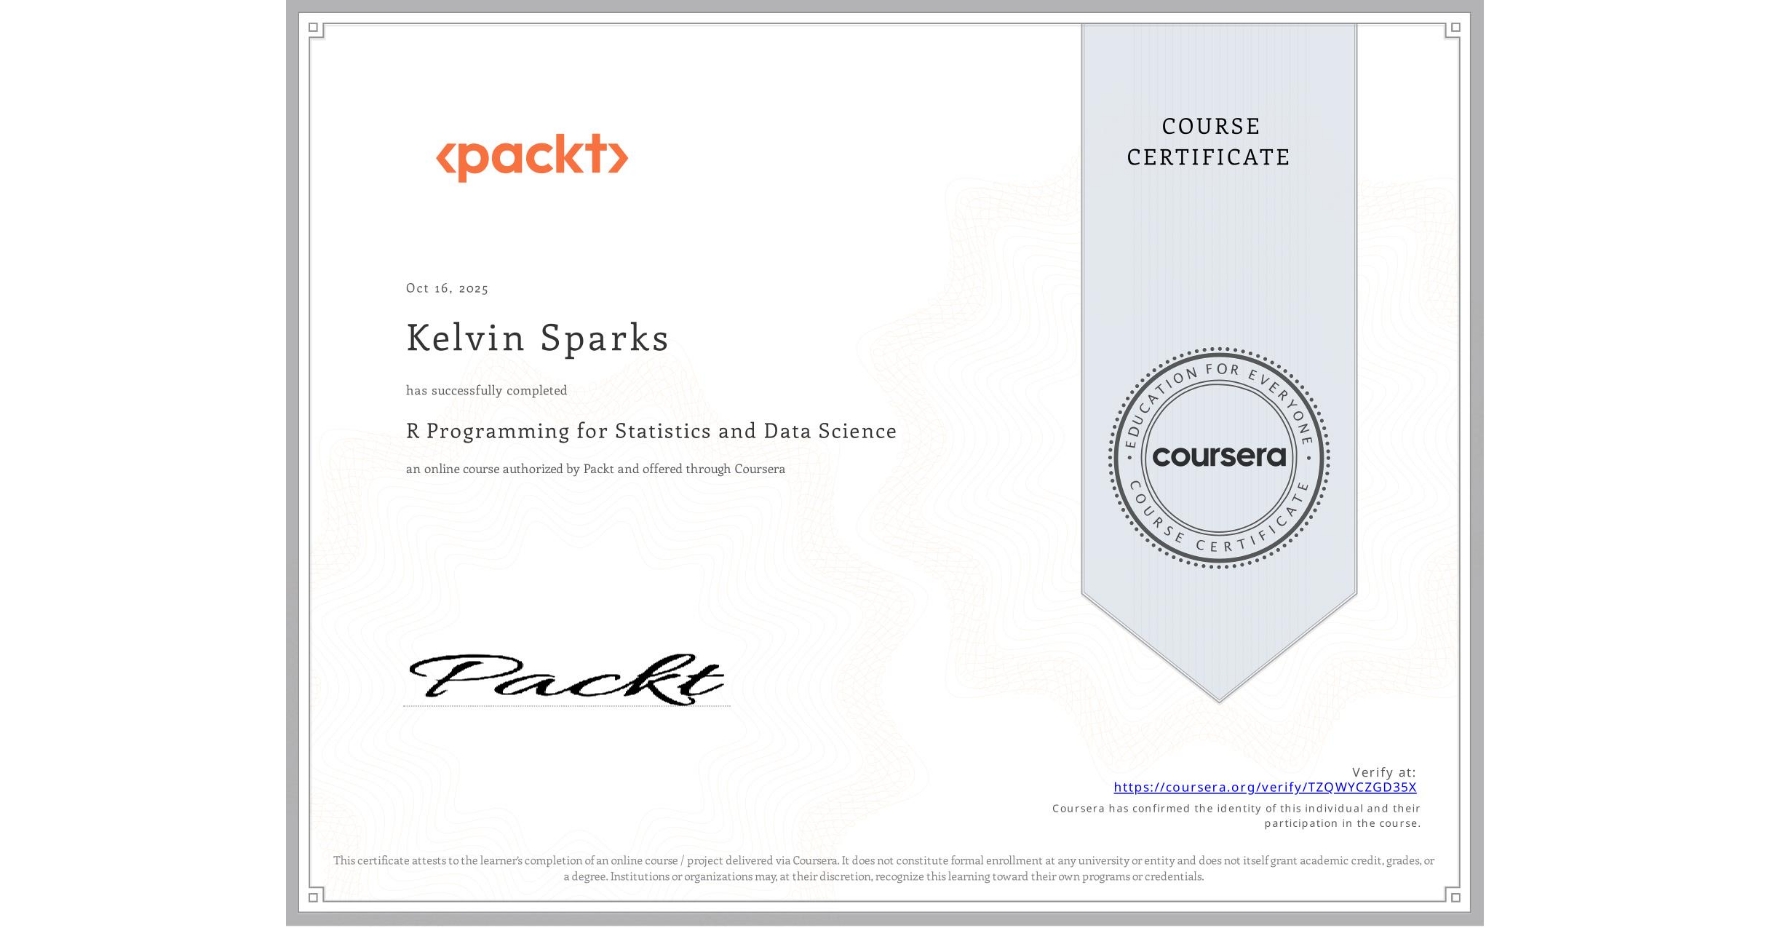
R Programming for Statistics and Data Science
Completed by Kelvin Sparks
October 15, 2025
8 hours (approximately)
Kelvin Sparks's account is verified. Coursera certifies their successful completion of R Programming for Statistics and Data Science

What you will learn
Differentiate between data structures (vectors, matrices, data frames)
Conduct hypothesis testing and interpret statistical results
Assess the fit of linear regression models
Visualize data using ggplot2 for insightful presentation
Skills you will gain
- Category: Regression Analysis
- Category: Plot (Graphics)
- Category: Data Science
- Category: Ggplot2
- Category: Exploratory Data Analysis
- Category: Data Visualization
- Category: Statistical Visualization
- Category: Data Manipulation
- Category: Statistical Hypothesis Testing
- Category: Data-oriented programming
- Category: R Programming
- Category: Statistical Programming