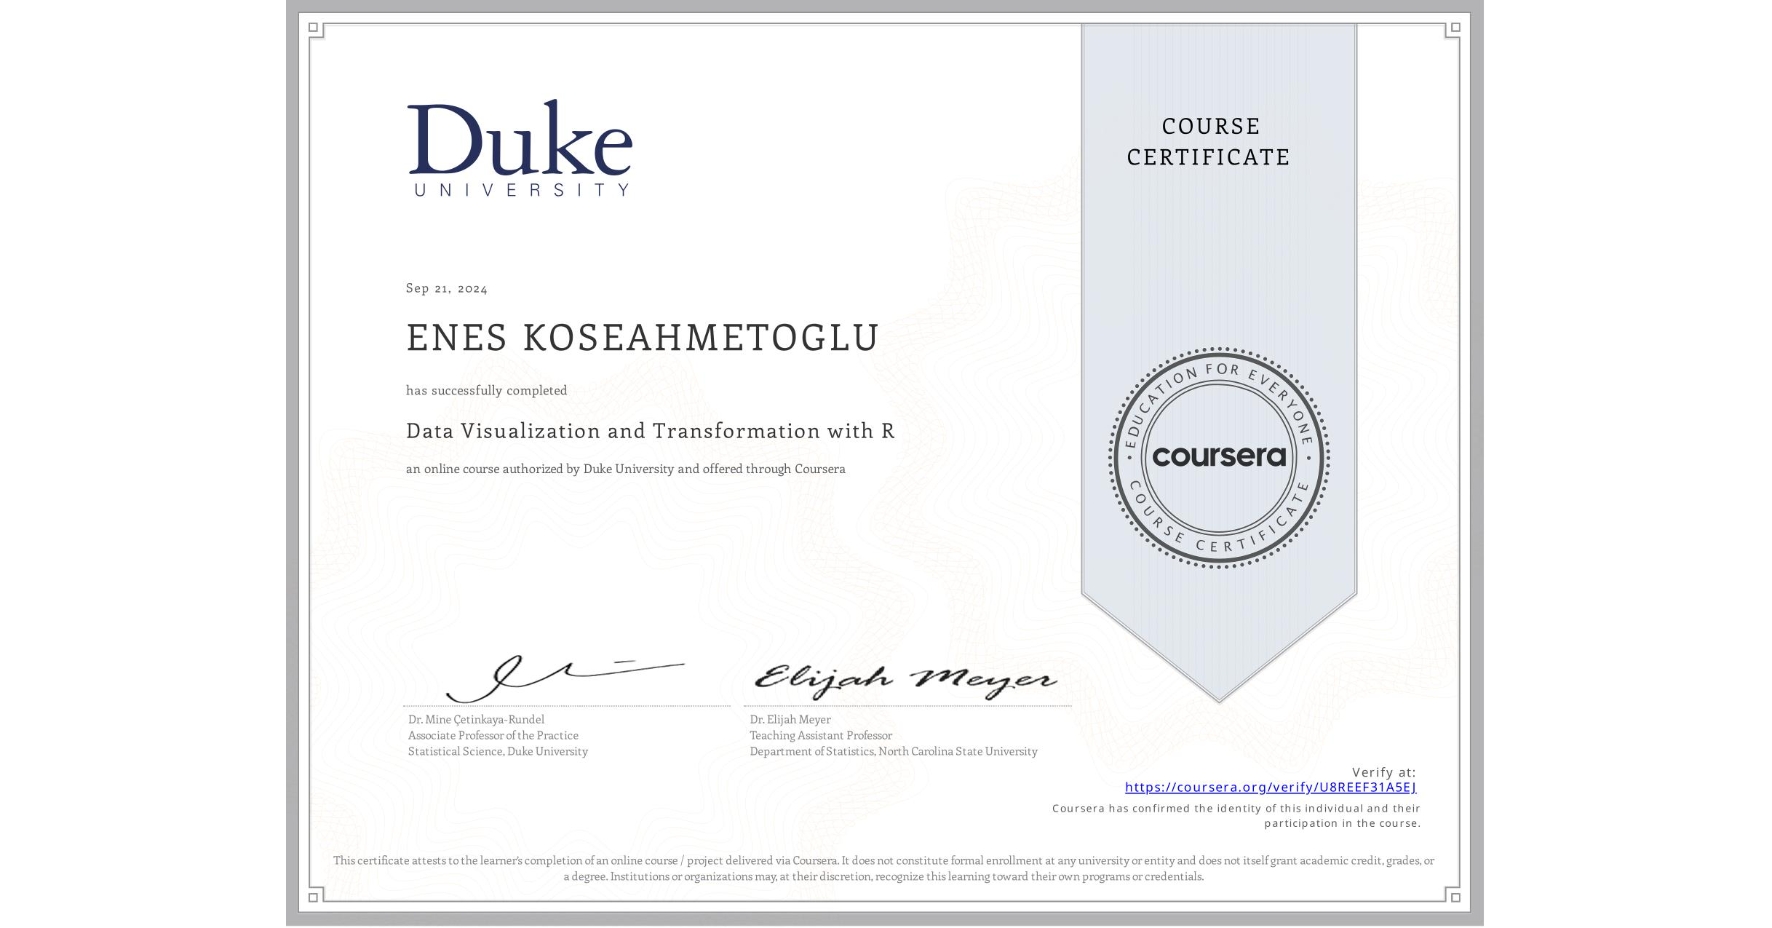
Data Visualization and Transformation with R
Completed by ENES KOSEAHMETOGLU
September 21, 2024
13 hours (approximately)
ENES KOSEAHMETOGLU's account is verified. Coursera certifies their successful completion of Data Visualization and Transformation with R

What you will learn
Transform, visualize, summarize, and analyze data in R, with packages from the Tidyverse, using RStudio
Carry out analyses in a reproducible and shareable manner with Quarto
Learn to effectively communicate results through an optional written project version controlled with Git and hosted on GitHub
Skills you will gain
- Category: Version Control
- Category: Data Transformation
- Category: R (Software)
- Category: Tidyverse (R Package)
- Category: Statistical Reporting
- Category: Scientific Visualization
- Category: Data Science
- Category: Statistics
- Category: Data Analysis
- Category: Plot (Graphics)
- Category: Data Wrangling
- Category: Statistical Visualization