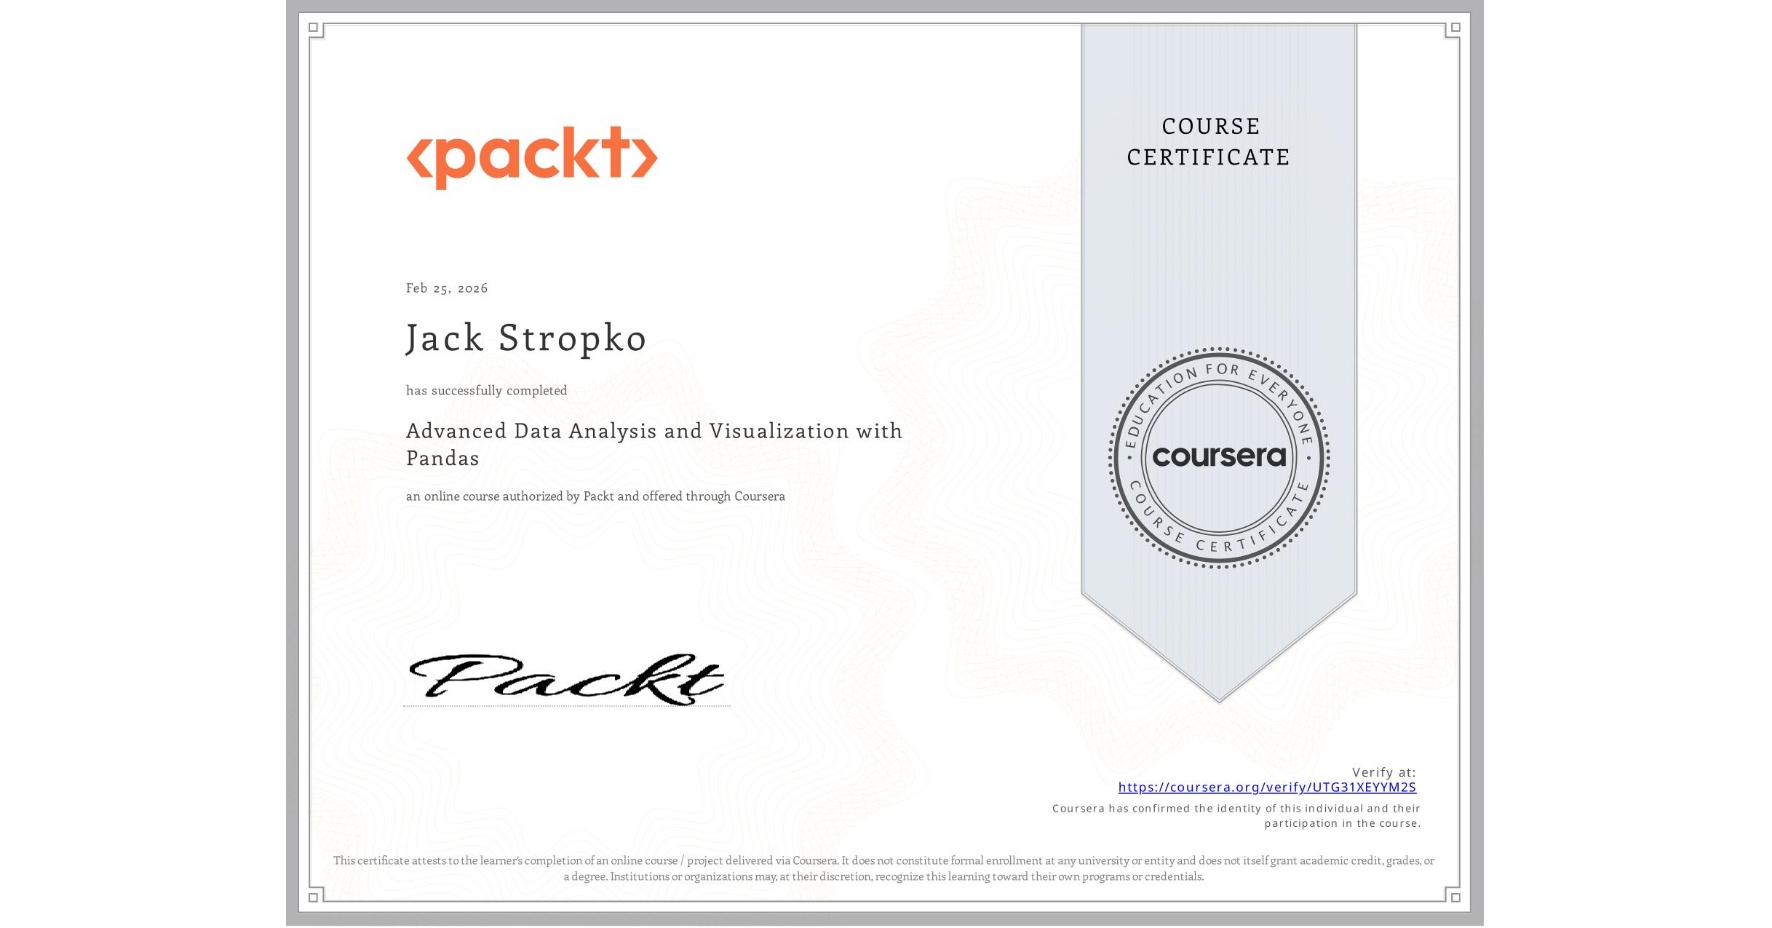
Advanced Data Analysis and Visualization with Pandas
Completed by Jack Stropko
February 25, 2026
5 hours (approximately)
Jack Stropko's account is verified. Coursera certifies their successful completion of Advanced Data Analysis and Visualization with Pandas

What you will learn
Demonstrate proficiency in exporting and importing data in CSV and Excel formats using Pandas.
Create and customize data visualizations using Matplotlib to effectively present insights.
Adjust Pandas settings and parameters to optimize data analysis for specific needs.
Apply advanced Pandas techniques to streamline data workflows and improve efficiency in data handling and analysis.
Skills you will gain
- Category: Data Visualization Software
- Category: Data Presentation
- Category: Spreadsheet Software
- Category: Microsoft Excel
- Category: Pandas (Python Package)
- Category: Data Manipulation
- Category: Data Import/Export
- Category: File I/O
- Category: Time Series Analysis and Forecasting
- Category: Matplotlib
- Category: Plot (Graphics)
- Category: Data Analysis