Results for "gantt chart visualization"
 Status: Preview
Universidad Nacional Autónoma de México
Skills you'll gain: Environmental Issue, Physical Science, Climate Change Adaptation, Environment, Climate Change Mitigation, Geographic Information Systems, Environmental Science, Physics, Simulation and Simulation Software, Experimentation, Mathematical Modeling, Scientific Visualization
 Status: Free Trial
Simplilearn
Skills you'll gain: Data Visualization, Microsoft Excel, Excel Formulas, Pivot Tables And Charts, Dashboard, Excel Macros, Data Analysis, Analytics, Data Cleansing, Regression Analysis, Descriptive Statistics
Skills you'll gain: Exploratory Data Analysis, Correlation Analysis, Matplotlib, Seaborn, Data Cleansing, Data Visualization, Pandas (Python Package), Data Analysis, NumPy, Statistical Analysis, Python Programming
 Status: Free Trial
Corporate Finance Institute
Skills you'll gain: Dashboard, Microsoft Excel, Pivot Tables And Charts, Star Schema, Spreadsheet Software, Data Transformation, Data Analysis Expressions (DAX), Data Storytelling, Data Analysis, Excel Formulas, Extract, Transform, Load, Consolidation, Data Visualization Software, Data Presentation, Data Modeling, Business Intelligence, Competitive Analysis, Data Manipulation, Data Cleansing, Data Integration
 Status: Free Trial
University of London
Skills you'll gain: Web Applications, MongoDB, Interactive Data Visualization, JavaScript Frameworks, User Interface and User Experience (UI/UX) Design, Responsive Web Design, Collaborative Software, Data Visualization Software, Full-Stack Web Development, Front-End Web Development, Application Development, Databases, User Requirements Documents, Real Time Data
 Status: Free Trial
California Institute of the Arts
Skills you'll gain: Game Design, Prototyping, Software Design Documents, Visualization (Computer Graphics), Ideation, Conceptual Design, Usability Testing, Graphic and Visual Design, Peer Review, Creativity
 Status: Free Trial
Skills you'll gain: Business Analysis, Project Management, Risk Management, Project Planning, Data Visualization, Agile Project Management, Microsoft Excel, Cost Management, Business Systems Analysis, Project Management Office (PMO), Stakeholder Engagement, Excel Formulas, Scope Management, Pivot Tables And Charts, Dashboard, Business Analytics, Stakeholder Management, Business Requirements, Data Analysis, Data Validation
 Status: Free Trial
Microsoft
Skills you'll gain: Generative AI, Microsoft Copilot, Generative Adversarial Networks (GANs), Natural Language Processing, Data Quality, Anomaly Detection, Data Storytelling, Technical Communication, Responsible AI, Data Visualization, Data Ethics, Data-Driven Decision-Making, Interactive Data Visualization, Data Pipelines, Data Cleansing, Data Visualization Software, Data Preprocessing, Data Science, Autoencoders, Critical Thinking
 Status: Preview
Michigan State University
Skills you'll gain: Infographics, Adobe Illustrator, Graphic and Visual Design, Data Mapping, Graphic Design, Typography, Layout Design, Design Elements And Principles, Storytelling, Color Theory
 Status: Free Trial
Skills you'll gain: Transfer Learning, Model Evaluation, Vision Transformer (ViT), Keras (Neural Network Library), Deep Learning, PyTorch (Machine Learning Library), Convolutional Neural Networks, Data Preprocessing, Model Deployment, Computer Vision, Geospatial Information and Technology, Machine Learning, Data Pipelines, Python Programming
 Status: Preview
Skills you'll gain: Exploratory Data Analysis, Data Compilation, Correlation Analysis, Data Collection, Statistical Inference, Statistics, Statistical Methods, Statistical Modeling, Predictive Modeling, Data Analysis, Statistical Hypothesis Testing, Data-Driven Decision-Making, Regression Analysis, Statistical Analysis, Probability & Statistics, Descriptive Statistics, Data Visualization
 Status: Preview
National Taiwan University
Skills you'll gain: Data Structures, Data Visualization Software, Financial Data, Financial Analysis, Data Analysis, Debugging, Programming Principles, Python Programming, Maintainability, Data Validation
In summary, here are 10 of our most popular gantt chart visualization courses
- Las estaciones del año y el clima: Universidad Nacional Autónoma de México
- Business Analytics using Excel: Simplilearn
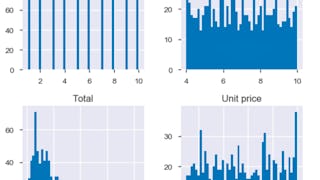
- Exploratory Data Analysis With Python and Pandas: Coursera
- Data Skills for Excel Professionals: Corporate Finance Institute
- Responsive Website Tutorial and Examples: University of London
- Game Design Document: Define the Art & Concepts: California Institute of the Arts
- Business Analysis Excel Tools and CCBA Training: Simplilearn
- Generative AI for Data Scientists: Microsoft
- Design and Make Infographics (Project-Centered Course): Michigan State University
- AI Capstone Project with Deep Learning : IBM


