Results for "creating dashboards"

Skills you'll gain: Budgeting, Microsoft Excel, Budget Management, Operating Budget, Excel Formulas, Spreadsheet Software, Financial Data, Microsoft Office
 Status: Free Trial
Skills you'll gain: Business Intelligence, Data Warehousing, Dashboard, Databases, Data Mart, Data Analysis, Interactive Data Visualization, Business Analytics, Data-Driven Decision-Making, Star Schema, Data Visualization Software, SQL, Data Transformation
 Status: New
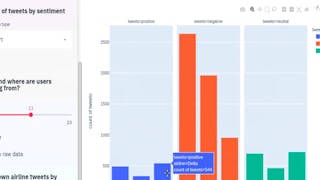
Skills you'll gain: Data Storytelling, Tableau Software, Dashboard, Interactive Data Visualization, Data Visualization Software, Data Analysis, Sales Strategy, Key Performance Indicators (KPIs), Trend Analysis, Performance Analysis, Investment Management, Financial Data
 Status: Preview
Knowledge Accelerators
Skills you'll gain: Power BI, Data Import/Export, Business Intelligence, Data Transformation, Microsoft Power Platform, Data Visualization, Dashboard, Data Visualization Software, Data Presentation, Microsoft Excel, Interactive Data Visualization, Data Cleansing, Microsoft Teams, Business Analytics, Data Analysis, Management Reporting, Microsoft 365, Data Modeling, Microsoft Office, Data Science
Skills you'll gain: Plotly, Dashboard, Pandas (Python Package), Data Manipulation, Interactive Data Visualization, Data Visualization Software, Data Visualization, Web Applications, Data Science, Data Analysis, Python Programming
Skills you'll gain: MySQL Workbench, MySQL, Database Design, SQL, Database Management, Relational Databases, Databases, Data Integration, Data Manipulation, Business Intelligence
 Status: Preview
Skills you'll gain: Microsoft Excel, Data Security

Skills you'll gain: Data Warehousing, Data Integration, Database Administration, SQL, Relational Databases, Data Analysis, Exploratory Data Analysis, Google Analytics
 Status: Free
Skills you'll gain: Interactive Data Visualization, Exploratory Data Analysis, Dashboard, Data Visualization Software, Data Integration, Heat Maps, Spatial Data Analysis, Data-Driven Decision-Making, Decision Support Systems, Business Intelligence Software, Geospatial Information and Technology, Data Mapping
 Status: Free
Skills you'll gain: Dashboard, Interactive Data Visualization, Tableau Software, Data Presentation, Data Import/Export, Data Visualization, Data Visualization Software, Business Intelligence, Data Analysis, Data Integration, Data Modeling
 Status: Free Trial
Johns Hopkins University
Skills you'll gain: Shiny (R Package), Dashboard, Ggplot2, Interactive Data Visualization, Data Visualization Software, Data Presentation, Application Development, Data Sharing, UI Components, Application Deployment
 Status: Free Trial
Skills you'll gain: Management Reporting, Change Management
Searches related to creating dashboards
In summary, here are 10 of our most popular creating dashboards courses
- Creating a Budget with Microsoft Excel: Coursera
- Discovering BI: From Warehousing to Interactive Dashboards: Coursera
- Learn Tableau by Working on Exciting Dashboards: Packt
- Data-Driven Decisions with Power BI: Knowledge Accelerators
- Create Interactive Dashboards with Streamlit and Python: Coursera
- Database Creation and Modeling using MYSQL Workbench: Coursera
- Data Storytelling with Power BI: Edureka
- Creating a Data Warehouse Through Joins and Unions: Google Cloud
- Dashboards in Qlik Sense: Decision-Support Dashboards: Coursera
- Multi-Table data analysis with Tableau: Customer Analysis: Coursera


