• For Individuals
  • For Businesses
  • For Universities
  • For Governments
Degrees
Log In
Join for Free
  • Browse
  • Creating Charts

Results for "creating charts"


  • Status: Free Trial
    Free Trial
    T

    Tableau Learning Partner

    Advanced Data Visualization with Tableau

    Skills you'll gain: Data Visualization Software, Spatial Data Analysis, Tableau Software, Data Storytelling, Interactive Data Visualization, Data Presentation, Stakeholder Communications, Geospatial Mapping, Business Reporting, Data Analysis, Business Analytics, Data Mapping

    4.9
    Rating, 4.9 out of 5 stars
    ·
    104 reviews

    Beginner · Course · 1 - 4 Weeks

  • Status: Preview
    Preview
    M

    Michigan State University

    Design and Make Infographics (Project-Centered Course)

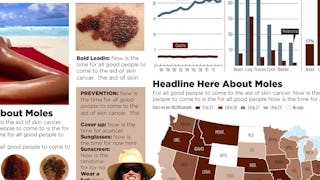
    Skills you'll gain: Infographics, Adobe Illustrator, Graphic and Visual Design, Data Mapping, Graphic Design, Typography, Layout Design, Design Elements And Principles, Storytelling, Color Theory

    4.6
    Rating, 4.6 out of 5 stars
    ·
    960 reviews

    Mixed · Course · 1 - 4 Weeks

  • C

    Coursera

    Creating a Visual Tasks Guide with Microsoft PowerPoint

    Skills you'll gain: Educational Materials, Education Software and Technology, Train The Trainer, Microsoft Office, Personal Development

    4.9
    Rating, 4.9 out of 5 stars
    ·
    18 reviews

    Beginner · Guided Project · Less Than 2 Hours

  • Status: New
    New
    Status: Preview
    Preview
    C

    Coursera

    Kubernetes with Helm Charts: Deploy & Manage Apps

    Skills you'll gain: Kubernetes, Containerization, CI/CD, Cloud-Native Computing, Microservices, Application Deployment, Continuous Deployment, Application Lifecycle Management, YAML, Package and Software Management, Release Management, Configuration Management, Version Control, Application Security, Command-Line Interface

    Intermediate · Course · 1 - 4 Weeks

  • Status: Preview
    Preview
    C

    Coursera

    Introduction to Data Visualization in Qlik Sense

    Skills you'll gain: Data Visualization, Data-Driven Decision-Making, Data Visualization Software, Data Literacy, Interactive Data Visualization, Business Intelligence, Data Storytelling, Data Presentation, Dashboard

    4.7
    Rating, 4.7 out of 5 stars
    ·
    48 reviews

    Beginner · Course · 1 - 4 Weeks

  • C

    Coursera

    Create Charts and Dashboard using Google Sheets

    Skills you'll gain: Dashboard, Google Sheets, Spreadsheet Software, Pivot Tables And Charts, Data Visualization, Data Visualization Software, Data Presentation, Interactive Data Visualization, Excel Formulas, Data Analysis, Data Manipulation

    4.6
    Rating, 4.6 out of 5 stars
    ·
    647 reviews

    Beginner · Guided Project · Less Than 2 Hours

  • C

    Coursera

    Create Charts and Dashboards Using Microsoft Excel

    Skills you'll gain: Dashboard, Microsoft Excel, Microsoft 365, Microsoft Office, Spreadsheet Software, Data Visualization, Trend Analysis, Data Analysis

    4.6
    Rating, 4.6 out of 5 stars
    ·
    1K reviews

    Intermediate · Guided Project · Less Than 2 Hours

  • Status: Free Trial
    Free Trial
    P

    PwC

    Data Visualization with Advanced Excel

    Skills you'll gain: Data Visualization, Data Presentation, Dashboard, Data Storytelling, Data Visualization Software, Microsoft Excel, Spreadsheet Software, Excel Formulas, Graphing, Pivot Tables And Charts, Data Modeling, Databases, Data Analysis, Simulation and Simulation Software

    4.8
    Rating, 4.8 out of 5 stars
    ·
    3K reviews

    Beginner · Course · 1 - 4 Weeks

  • Status: Free Trial
    Free Trial
    W

    Wesleyan University

    Creating Behavioral Change

    Skills you'll gain: Motivational Interviewing, Cognitive Behavioral Therapy, Mental Health Therapies, Behavioral Health, Mental and Behavioral Health, Psychotherapy, Psychology, Experimentation, Health Education, Goal Setting

    4.8
    Rating, 4.8 out of 5 stars
    ·
    192 reviews

    Beginner · Course · 1 - 4 Weeks

  • Status: Free Trial
    Free Trial
    U

    University of Michigan

    Arranging and Visualizing Data in R

    Skills you'll gain: Exploratory Data Analysis, Rmarkdown, R (Software), Tidyverse (R Package), Statistical Visualization, Data Visualization, Data Visualization Software, R Programming, Ggplot2, Data Wrangling, Scatter Plots, Data Manipulation, Histogram, Scripting, Package and Software Management, Data Import/Export

    5
    Rating, 5 out of 5 stars
    ·
    7 reviews

    Beginner · Course · 1 - 4 Weeks

  • Status: Free Trial
    Free Trial
    U

    University of California, Irvine

    Data Visualization Best Practices

    Skills you'll gain: Data Visualization Software, Statistical Visualization, Data Presentation, Plot (Graphics), Data Storytelling, Tableau Software, Exploratory Data Analysis, Descriptive Statistics, Data Analysis, Descriptive Analytics, Histogram

    3.9
    Rating, 3.9 out of 5 stars
    ·
    20 reviews

    Mixed · Course · 1 - 4 Weeks

  • Status: Free Trial
    Free Trial
    W

    Whizlabs

    Power BI: Data Visualization and Analysis

    Skills you'll gain: Business Intelligence, Data Presentation, Data Storytelling, Interactive Data Visualization, Data Visualization Software, Business Analytics, Power BI, Pivot Tables And Charts, Dashboard, Key Performance Indicators (KPIs), Performance Reporting, Data Analysis, Scatter Plots, Business Reporting, Trend Analysis, Time Series Analysis and Forecasting

    3.9
    Rating, 3.9 out of 5 stars
    ·
    8 reviews

    Intermediate · Course · 1 - 4 Weeks

1234…180

In summary, here are 10 of our most popular creating charts courses

  • Advanced Data Visualization with Tableau: Tableau Learning Partner
  • Design and Make Infographics (Project-Centered Course): Michigan State University
  • Creating a Visual Tasks Guide with Microsoft PowerPoint: Coursera
  • Kubernetes with Helm Charts: Deploy & Manage Apps: Coursera
  • Introduction to Data Visualization in Qlik Sense: Coursera
  • Create Charts and Dashboard using Google Sheets: Coursera
  • Create Charts and Dashboards Using Microsoft Excel: Coursera
  • Data Visualization with Advanced Excel: PwC
  • Creating Behavioral Change: Wesleyan University
  • Arranging and Visualizing Data in R : University of Michigan

Other topics to explore

Arts and Humanities
338 courses
Business
1095 courses
Computer Science
668 courses
Data Science
425 courses
Information Technology
145 courses
Health
471 courses
Math and Logic
70 courses
Personal Development
137 courses
Physical Science and Engineering
413 courses
Social Sciences
401 courses
Language Learning
150 courses

Coursera Footer

Skills

  • Artificial Intelligence (AI)
  • Cybersecurity
  • Data Analytics
  • Digital Marketing
  • English Speaking
  • Generative AI (GenAI)
  • Microsoft Excel
  • Microsoft Power BI
  • Project Management
  • Python

Certificates & Programs

  • Google Cybersecurity Certificate
  • Google Data Analytics Certificate
  • Google IT Support Certificate
  • Google Project Management Certificate
  • Google UX Design Certificate
  • IBM Data Analyst Certificate
  • IBM Data Science Certificate
  • Machine Learning Certificate
  • Microsoft Power BI Data Analyst Certificate
  • UI / UX Design Certificate

Industries & Careers

  • Business
  • Computer Science
  • Data Science
  • Education & Teaching
  • Engineering
  • Finance
  • Healthcare
  • Human Resources (HR)
  • Information Technology (IT)
  • Marketing

Career Resources

  • Career Aptitude Test
  • Examples of Strengths and Weaknesses for Job Interviews
  • High-Income Skills to Learn
  • How Does Cryptocurrency Work?
  • How to Highlight Duplicates in Google Sheets
  • How to Learn Artificial Intelligence
  • Popular Cybersecurity Certifications
  • Preparing for the PMP Certification
  • Signs You Will Get the Job After an Interview
  • What Is Artificial Intelligence?

Coursera

  • About
  • What We Offer
  • Leadership
  • Careers
  • Catalog
  • Coursera Plus
  • Professional Certificates
  • MasterTrack® Certificates
  • Degrees
  • For Enterprise
  • For Government
  • For Campus
  • Become a Partner
  • Social Impact
  • Free Courses
  • Share your Coursera learning story

Community

  • Learners
  • Partners
  • Beta Testers
  • Blog
  • The Coursera Podcast
  • Tech Blog

More

  • Press
  • Investors
  • Terms
  • Privacy
  • Help
  • Accessibility
  • Contact
  • Articles
  • Directory
  • Affiliates
  • Modern Slavery Statement
  • Do Not Sell/Share
Learn Anywhere
Download on the App Store
Get it on Google Play
Logo of Certified B Corporation
© 2026 Coursera Inc. All rights reserved.
  • Coursera Facebook
  • Coursera Linkedin
  • Coursera Twitter
  • Coursera YouTube
  • Coursera Instagram
  • Coursera TikTok