• For Individuals
  • For Businesses
  • For Universities
  • For Governments
Degrees
Log In
Join for Free
  • Browse
  • Create And Manage Helm Charts


Results for "create+and+manage+helm+charts"


  • C

    Coursera

    Plots Creation using Matplotlib Python

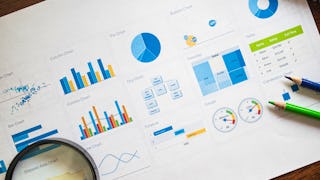
    Skills you'll gain: Matplotlib, Box Plots, Plot (Graphics), Seaborn, Data Visualization, Data Visualization Software, Pandas (Python Package), Scatter Plots, Data Import/Export, Histogram, Python Programming, Data Manipulation, Data Analysis, Data Structures

    3.9
    Rating, 3.9 out of 5 stars
    ·
    9 reviews

    Beginner · Guided Project · Less Than 2 Hours

  • C

    Coursera

    Data Visualization with Plotly Express

    Skills you'll gain: Plotly, Interactive Data Visualization, Data Visualization Software, Scatter Plots, Ggplot2, Data Analysis, Python Programming, Data Science, Machine Learning

    4.7
    Rating, 4.7 out of 5 stars
    ·
    269 reviews

    Intermediate · Guided Project · Less Than 2 Hours

  • C

    Coursera

    Mastering Data Visualization in Microsoft PowerPoint

    Skills you'll gain: Data Visualization, Data Visualization Software, Data Presentation, Interactive Data Visualization, Infographics, Microsoft Office

    4.8
    Rating, 4.8 out of 5 stars
    ·
    29 reviews

    Beginner · Guided Project · Less Than 2 Hours

  • C

    Coursera

    Create IT Diagrams with Lucidchart

    Skills you'll gain: Diagram Design, Data Import/Export, Collaborative Software, Technical Documentation, User Accounts

    4.8
    Rating, 4.8 out of 5 stars
    ·
    30 reviews

    Beginner · Guided Project · Less Than 2 Hours

  • Status: Free
    Free
    C

    Coursera

    Dynamic Dashboards with Tableau: Advanced Sales Analysis

    Skills you'll gain: Dashboard, Data Visualization, Interactive Data Visualization, Data Presentation, Tableau Software, Data Visualization Software, Exploratory Data Analysis, Business Intelligence, Data Analysis

    Intermediate · Guided Project · Less Than 2 Hours

  • P

    Packt

    Data Visualization in Stata

    Skills you'll gain: Statistical Visualization, Data Visualization Software, Data Visualization, Scatter Plots, Plot (Graphics), Box Plots, Exploratory Data Analysis, Histogram, Descriptive Statistics, Heat Maps, Graphing

    Intermediate · Course · 1 - 3 Months

  • Status: Free
    Free
    C

    Coursera

    Responsive Design in Bootstrap: Create an Admin Dashboard

    Skills you'll gain: Chart.js, Responsive Web Design, Bootstrap (Front-End Framework), UI Components, Dashboard, HTML and CSS, Data Visualization, Web Design, Web Applications, User Interface (UI), Web Development

    Intermediate · Guided Project · Less Than 2 Hours

  • C

    Coursera

    Charts, Pictures, Themes, and Styles in Microsoft Excel

    Skills you'll gain: Microsoft Excel, Spreadsheet Software, Microsoft Office, User Accounts

    4.6
    Rating, 4.6 out of 5 stars
    ·
    17 reviews

    Beginner · Guided Project · Less Than 2 Hours

  • Status: Free Trial
    Free Trial
    U

    University of California, Irvine

    Dashboarding and Deployment

    Skills you'll gain: Dashboard, Data Storytelling, Data Presentation, Interactive Data Visualization, Data Visualization Software, Tableau Software, Geospatial Information and Technology, Data Analysis, Analytical Skills, Application Deployment, Network Analysis, Financial Data, Financial Analysis, Time Series Analysis and Forecasting

    5
    Rating, 5 out of 5 stars
    ·
    8 reviews

    Mixed · Course · 1 - 4 Weeks

  • C

    Coursera

    Create a Marketing Analysis dashboard using G-Spreadsheets

    Skills you'll gain: Dashboard, Data Visualization, Data Entry, Excel Formulas, Data Presentation, Google Sheets, Spreadsheet Software, Data Literacy, Management Reporting, Business Reporting, Marketing Analytics, Market Analysis, Productivity Software

    4.6
    Rating, 4.6 out of 5 stars
    ·
    16 reviews

    Beginner · Guided Project · Less Than 2 Hours

  • P

    Packt

    How to Visualize Data with R

    Skills you'll gain: Data Visualization Software, Data Visualization, Statistical Visualization, Ggplot2, Plot (Graphics), R Programming, Scatter Plots, Data Collection, Data Analysis, Data Manipulation, Data Import/Export, Regression Analysis, Data Preprocessing, Software Installation

    Intermediate · Course · 1 - 4 Weeks

  • C

    Coursera

    Utiliser LucidChart pour petites entreprises

    Skills you'll gain: Diagram Design, Process Flow Diagrams, User Accounts, Process Mapping, Organizational Structure, Data Visualization, Creativity

    Beginner · Guided Project · Less Than 2 Hours

1…6789

In summary, here are 10 of our most popular create+and+manage+helm+charts courses

  • Plots Creation using Matplotlib Python: Coursera
  • Data Visualization with Plotly Express: Coursera
  • Mastering Data Visualization in Microsoft PowerPoint: Coursera
  • Create IT Diagrams with Lucidchart: Coursera
  • Dynamic Dashboards with Tableau: Advanced Sales Analysis: Coursera
  • Data Visualization in Stata: Packt
  • Responsive Design in Bootstrap: Create an Admin Dashboard: Coursera
  • Charts, Pictures, Themes, and Styles in Microsoft Excel: Coursera
  • Dashboarding and Deployment: University of California, Irvine
  • Create a Marketing Analysis dashboard using G-Spreadsheets: Coursera

Other topics to explore

Arts and Humanities
338 courses
Business
1095 courses
Computer Science
668 courses
Data Science
425 courses
Information Technology
145 courses
Health
471 courses
Math and Logic
70 courses
Personal Development
137 courses
Physical Science and Engineering
413 courses
Social Sciences
401 courses
Language Learning
150 courses

Coursera Footer

Skills

  • Artificial Intelligence (AI)
  • Cybersecurity
  • Data Analytics
  • Digital Marketing
  • English Speaking
  • Generative AI (GenAI)
  • Microsoft Excel
  • Microsoft Power BI
  • Project Management
  • Python

Certificates & Programs

  • Google Cybersecurity Certificate
  • Google Data Analytics Certificate
  • Google IT Support Certificate
  • Google Project Management Certificate
  • Google UX Design Certificate
  • IBM Data Analyst Certificate
  • IBM Data Science Certificate
  • Machine Learning Certificate
  • Microsoft Power BI Data Analyst Certificate
  • UI / UX Design Certificate

Industries & Careers

  • Business
  • Computer Science
  • Data Science
  • Education & Teaching
  • Engineering
  • Finance
  • Healthcare
  • Human Resources (HR)
  • Information Technology (IT)
  • Marketing

Career Resources

  • Career Aptitude Test
  • Examples of Strengths and Weaknesses for Job Interviews
  • High-Income Skills to Learn
  • How Does Cryptocurrency Work?
  • How to Highlight Duplicates in Google Sheets
  • How to Learn Artificial Intelligence
  • Popular Cybersecurity Certifications
  • Preparing for the PMP Certification
  • Signs You Will Get the Job After an Interview
  • What Is Artificial Intelligence?

Coursera

  • About
  • What We Offer
  • Leadership
  • Careers
  • Catalog
  • Coursera Plus
  • Professional Certificates
  • MasterTrack® Certificates
  • Degrees
  • For Enterprise
  • For Government
  • For Campus
  • Become a Partner
  • Social Impact
  • Free Courses
  • Share your Coursera learning story

Community

  • Learners
  • Partners
  • Beta Testers
  • Blog
  • The Coursera Podcast
  • Tech Blog

More

  • Press
  • Investors
  • Terms
  • Privacy
  • Help
  • Accessibility
  • Contact
  • Articles
  • Directory
  • Affiliates
  • Modern Slavery Statement
  • Do Not Sell/Share
Learn Anywhere
Download on the App Store
Get it on Google Play
Logo of Certified B Corporation
© 2025 Coursera Inc. All rights reserved.
  • Coursera Facebook
  • Coursera Linkedin
  • Coursera Twitter
  • Coursera YouTube
  • Coursera Instagram
  • Coursera TikTok