Results for "creating maps and visualizations using gis software for engineering applications"
 Status: Free Trial
L&T EduTech
Skills you'll gain: Construction Engineering, Geospatial Mapping, Geospatial Information and Technology, Geographic Information Systems, Spatial Data Analysis, Construction, Construction Management, Visualization (Computer Graphics), Civil and Architectural Engineering, Spatial Analysis, Global Positioning Systems, GIS Software, Survey Creation, AutoCAD Civil 3D, Building Information Modeling, 3D Modeling, Data Import/Export
 Status: NewStatus: Preview
Skills you'll gain: Data Storytelling, Data Presentation, Plotly, Matplotlib, Exploratory Data Analysis, Plot (Graphics), Data Visualization, Interactive Data Visualization, Data Visualization Software, Statistical Visualization, Seaborn, Data Analysis, Box Plots, Descriptive Statistics, Jupyter, Data Science, Anomaly Detection, Python Programming, GitHub

Skills you'll gain: Dashboard, Microsoft Excel, Microsoft 365, Microsoft Office, Spreadsheet Software, Data Visualization, Trend Analysis, Data Analysis
 Status: Free Trial
L&T EduTech
Skills you'll gain: Geospatial Information and Technology, Spatial Analysis, Geographic Information Systems, GIS Software, Database Management, ArcGIS, Global Positioning Systems, Decision Support Systems, Data Modeling, Open Source Technology, Web Applications, Mobile Development
Skills you'll gain: Wireframing, Mockups, Web Content, Web Design, Information Architecture, Collaborative Software, User Experience Design

Skills you'll gain: Data Visualization, Microsoft Excel, Data Visualization Software, Data Import/Export, Business Reporting, Report Writing, Microsoft 365
 Status: NewStatus: Preview
Northeastern University
Skills you'll gain: Data Storytelling, Interactive Data Visualization, Data Visualization Software, Matplotlib, Data Preprocessing, Pandas (Python Package), Scatter Plots, Data Cleansing, Data Integration, Data Transformation, Big Data, Programming Principles, Python Programming
 Status: NewStatus: Free Trial
Skills you'll gain: Rmarkdown, Knitr, Exploratory Data Analysis, Dimensionality Reduction, Ggplot2, Plotly, Data Visualization, Data Visualization Software, Statistical Visualization, Data Storytelling, Statistical Analysis, Generative AI, R Programming, Correlation Analysis, Data Analysis, Tidyverse (R Package), Scatter Plots, Descriptive Statistics, Data Cleansing, Data Preprocessing
 Status: Free Trial
Johns Hopkins University
Skills you'll gain: Shiny (R Package), Dashboard, Ggplot2, Interactive Data Visualization, Data Visualization Software, Data Presentation, Application Development, Data Sharing, UI Components, Application Deployment
 Status: Preview
Ball State University
Skills you'll gain: Data Visualization, Rmarkdown, Exploratory Data Analysis, Data Visualization Software, Ggplot2, Interactive Data Visualization, Plot (Graphics), Statistical Visualization, R (Software), R Programming, Data Storytelling, Histogram, Scatter Plots, Data Analysis, Tidyverse (R Package), Data Manipulation
 Status: NewStatus: Free Trial
University of Pittsburgh
Skills you'll gain: Data Storytelling, Interactive Data Visualization, Data Visualization Software, Data Presentation, Data Visualization, Tableau Software, Matplotlib, Geospatial Information and Technology, Spatial Analysis, Geospatial Mapping, Visualization (Computer Graphics), Seaborn, Infographics, Heat Maps, Data Ethics, Text Mining, Data Mapping, Network Analysis
 Status: Free Trial
Johns Hopkins University
Skills you'll gain: Ggplot2, Data Visualization Software, Data Visualization, Datamaps, Visualization (Computer Graphics), Interactive Data Visualization, Scatter Plots, Histogram, Graphic and Visual Design, R Programming, Geospatial Information and Technology, Geospatial Mapping
In summary, here are 10 of our most popular creating maps and visualizations using gis software for engineering applications courses
- Geospatial Technology for Construction : L&T EduTech
- Explore and Visualize Data the Python Way: Coursera
- Create Charts and Dashboards Using Microsoft Excel: Coursera
- Geospatial Information Technology Essentials: L&T EduTech
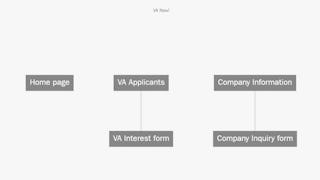
- Build a Website Map with Jumpchart: Coursera
- Data Visualization using Microsoft Excel: Coursera
- Computation and Visualization for Analytics Part 1: Northeastern University
- Exploratory Data Analysis and Visualization: Microsoft
- Publishing Visualizations in R with Shiny and flexdashboard: Johns Hopkins University
- Data Visualization: Ball State University


