• For Individuals
  • For Businesses
  • For Universities
  • For Governments
Degrees
Log In
Join for Free
  • Browse
  • Infographics

Infographics Courses

Infographic courses can help you learn visual storytelling, data visualization techniques, design principles, and effective communication strategies. You can build skills in using color theory, typography, and layout design to enhance your presentations. Many courses introduce tools like Adobe Illustrator, Canva, and Piktochart, which enable you to create engaging infographics that convey complex information clearly and attractively.


Popular Infographics Courses and Certifications


  • Status: Preview
    Preview
    M

    Michigan State University

    Design and Make Infographics (Project-Centered Course)

    Skills you'll gain: Infographics, Adobe Illustrator, Graphic and Visual Design, Data Mapping, Graphic Design, Typography, Layout Design, Design Elements And Principles, Storytelling, Color Theory

    4.6
    Rating, 4.6 out of 5 stars
    ·
    960 reviews

    Mixed · Course · 1 - 4 Weeks

  • Status: Free Trial
    Free Trial
    C

    Coursera

    Create an Infographic in Canva

    Skills you'll gain: Infographics, Canva (Software), Graphic and Visual Design, Design Elements And Principles

    4.6
    Rating, 4.6 out of 5 stars
    ·
    200 reviews

    Intermediate · Guided Project · Less Than 2 Hours

  • Status: New
    New
    P

    Packt

    PowerPoint Data Viz – Business Charting Techniques

    Skills you'll gain: Data Visualization, Microsoft PowerPoint, Data Storytelling, Microsoft Excel, Trend Analysis

    Intermediate · Course · 3 - 6 Months

  • Status: Preview
    Preview
    C

    Coursera

    Creating Infographics with GenAI for Marketing

    Skills you'll gain: Infographics, Data Visualization, Target Audience, Data Storytelling, Design Elements And Principles, Technical Communication, Content Creation, Generative AI, Process Mapping, Communication, ChatGPT

    4.5
    Rating, 4.5 out of 5 stars
    ·
    24 reviews

    Intermediate · Course · 1 - 4 Weeks

  • Status: New
    New
    Status: Free Trial
    Free Trial
    U

    University of Pittsburgh

    Data Visualization: Fundamentals to Interactive Storytelling

    Skills you'll gain: Data Storytelling, Data Presentation, Dashboard, Interactive Data Visualization, Data Visualization, Spatial Data Analysis, Data Visualization Software, Tableau Software, Geographic Information Systems, Data Literacy, Scientific Visualization, Statistical Visualization, Matplotlib, Visualization (Computer Graphics), Heat Maps, Seaborn, Geospatial Information and Technology, Network Analysis, Time Series Analysis and Forecasting, Geospatial Mapping

    Build toward a degree

    Intermediate · Specialization · 3 - 6 Months

  • Status: Free Trial
    Free Trial
    T

    The State University of New York

    Applied Digital Literacy

    Skills you'll gain: Digital Design, digital literacy, Infographics, Content Creation, Graphic Design, Multimedia, Brainstorming, Planning, Information Management, Literacy, Lifelong Learning, Computer Literacy, Critical Thinking, Investigation, Data Ethics, Research, Digital Communications, Open Source Technology, Intellectual Property, Web Content Accessibility Guidelines

    4.8
    Rating, 4.8 out of 5 stars
    ·
    313 reviews

    Beginner · Specialization · 3 - 6 Months

What brings you to Coursera today?

  • Status: Free Trial
    Free Trial
    M

    Microsoft

    Data Visualization Fundamentals

    Skills you'll gain: Data Storytelling, Data Presentation, Power BI, Data Visualization Software, Data Visualization, Interactive Data Visualization, Statistical Visualization, Dashboard, Data-Driven Decision-Making, Business Intelligence, Pivot Tables And Charts, Data Analysis, Scatter Plots, Histogram

    4.6
    Rating, 4.6 out of 5 stars
    ·
    97 reviews

    Beginner · Course · 1 - 4 Weeks

  • C

    Coursera

    Create Engaging Presentations with Easelly

    Skills you'll gain: Infographics, Graphic and Visual Design, Digital pedagogy, Developing Training Materials

    4.7
    Rating, 4.7 out of 5 stars
    ·
    46 reviews

    Beginner · Guided Project · Less Than 2 Hours

  • Status: Free Trial
    Free Trial
    M

    Macquarie University

    Data Visualization in Excel

    Skills you'll gain: Pivot Tables And Charts, Data Storytelling, Data Visualization Software, Data Visualization, Interactive Data Visualization, Spreadsheet Software, Dashboard, Microsoft Excel, Excel Macros, Infographics, Excel Formulas, Data Analysis, Forecasting

    4.9
    Rating, 4.9 out of 5 stars
    ·
    1.3K reviews

    Intermediate · Course · 1 - 3 Months

  • Status: Free Trial
    Free Trial
    A

    Adobe

    Multimedia Content Creation

    Skills you'll gain: Adobe Express, Content Creation, Web Content, Multimedia, Infographics, Storyboarding, Video Production, Visual Design, Design, Graphic and Visual Design, Video Editing, Digital Media Strategy, Storytelling, Communication

    4.7
    Rating, 4.7 out of 5 stars
    ·
    121 reviews

    Mixed · Course · 1 - 4 Weeks

  • C

    Coursera

    Create an infographic with Infogram

    Skills you'll gain: Data Storytelling, Infographics, Data Visualization, Storytelling, Diagram Design, Data Analysis, Graphic and Visual Design

    4.9
    Rating, 4.9 out of 5 stars
    ·
    9 reviews

    Beginner · Guided Project · Less Than 2 Hours

  • C

    Coursera

    Overview of Data Visualization

    Skills you'll gain: Data Visualization, Data Presentation, Data Literacy, Data Synthesis, Data Visualization Software, Google Sheets, Graphing

    4.7
    Rating, 4.7 out of 5 stars
    ·
    451 reviews

    Beginner · Guided Project · Less Than 2 Hours

Searches related to infographics

design and make infographics (project-centered course)
creating infographics with genai for marketing
teaching infographics with genially
create video, audio and infographics for online learning
create attractive infographics with creately
design infographics with prezi
create an infographic in canva
créez des infographies avec piktochart
1234…13

In summary, here are 10 of our most popular infographics courses

  • Design and Make Infographics (Project-Centered Course): Michigan State University
  • Create an Infographic in Canva: Coursera
  • PowerPoint Data Viz – Business Charting Techniques: Packt
  • Creating Infographics with GenAI for Marketing: Coursera
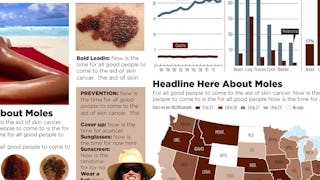
  • Data Visualization: Fundamentals to Interactive Storytelling: University of Pittsburgh
  • Applied Digital Literacy: The State University of New York
  • Data Visualization Fundamentals: Microsoft
  • Create Engaging Presentations with Easelly: Coursera
  • Data Visualization in Excel: Macquarie University
  • Multimedia Content Creation: Adobe

Skills you can learn in Business Essentials

Analytics (37)
Presentation (33)
Modeling (29)
Business Analytics (27)
Language (26)
Microsoft Excel (26)
Writing (26)
Speech (18)
Plan (17)
Business Communication (16)
Decision-making (16)
Leadership (15)

Frequently Asked Questions about Infographics

To excel in infographics, you should develop a blend of technical and creative skills. Key skills include graphic design principles, data analysis, and proficiency in design software such as Adobe Illustrator or Canva. Understanding color theory, typography, and layout design is also crucial. Additionally, being able to interpret data and translate it into visual formats is essential. Strong communication skills will help you convey your ideas clearly and effectively.‎

Yes. You can start learning infographics on Coursera for free in two ways:

  1. Preview the first module of many infographics courses at no cost. This includes video lessons, readings, graded assignments, and Coursera Coach (where available).
  2. Start a 7-day free trial for Specializations or Coursera Plus. This gives you full access to all course content across eligible programs within the timeframe of your trial.

If you want to keep learning, earn a certificate in infographics, or unlock full course access after the preview or trial, you can upgrade or apply for financial aid.‎

Learning infographics can be approached through a combination of online courses, practice, and real-world application. Start by enrolling in relevant courses to build your foundational knowledge. Then, practice creating your own infographics using tools like Canva or Adobe Illustrator. Seek feedback from peers or mentors to improve your designs. Additionally, studying existing infographics can provide inspiration and insights into effective design strategies.‎

This FAQ content has been made available for informational purposes only. Learners are advised to conduct additional research to ensure that courses and other credentials pursued meet their personal, professional, and financial goals.

Other topics to explore

Arts and Humanities
338 courses
Business
1095 courses
Computer Science
668 courses
Data Science
425 courses
Information Technology
145 courses
Health
471 courses
Math and Logic
70 courses
Personal Development
137 courses
Physical Science and Engineering
413 courses
Social Sciences
401 courses
Language Learning
150 courses

Coursera Footer

Skills

  • Artificial Intelligence (AI)
  • Cybersecurity
  • Data Analytics
  • Digital Marketing
  • English Speaking
  • Generative AI (GenAI)
  • Microsoft Excel
  • Microsoft Power BI
  • Project Management
  • Python

Certificates & Programs

  • Google Cybersecurity Certificate
  • Google Data Analytics Certificate
  • Google IT Support Certificate
  • Google Project Management Certificate
  • Google UX Design Certificate
  • IBM Data Analyst Certificate
  • IBM Data Science Certificate
  • Machine Learning Certificate
  • Microsoft Power BI Data Analyst Certificate
  • UI / UX Design Certificate

Industries & Careers

  • Business
  • Computer Science
  • Data Science
  • Education & Teaching
  • Engineering
  • Finance
  • Healthcare
  • Human Resources (HR)
  • Information Technology (IT)
  • Marketing

Career Resources

  • Career Aptitude Test
  • Examples of Strengths and Weaknesses for Job Interviews
  • High-Income Skills to Learn
  • How Does Cryptocurrency Work?
  • How to Highlight Duplicates in Google Sheets
  • How to Learn Artificial Intelligence
  • Popular Cybersecurity Certifications
  • Preparing for the PMP Certification
  • Signs You Will Get the Job After an Interview
  • What Is Artificial Intelligence?

Coursera

  • About
  • What We Offer
  • Leadership
  • Careers
  • Catalog
  • Coursera Plus
  • Professional Certificates
  • MasterTrack® Certificates
  • Degrees
  • For Enterprise
  • For Government
  • For Campus
  • Become a Partner
  • Social Impact
  • Free Courses
  • Share your Coursera learning story

Community

  • Learners
  • Partners
  • Beta Testers
  • Blog
  • The Coursera Podcast
  • Tech Blog

More

  • Press
  • Investors
  • Terms
  • Privacy
  • Help
  • Accessibility
  • Contact
  • Articles
  • Directory
  • Affiliates
  • Modern Slavery Statement
  • Do Not Sell/Share
Learn Anywhere
Download on the App Store
Get it on Google Play
Logo of Certified B Corporation
© 2026 Coursera Inc. All rights reserved.
  • Coursera Facebook
  • Coursera Linkedin
  • Coursera Twitter
  • Coursera YouTube
  • Coursera Instagram
  • Coursera TikTok