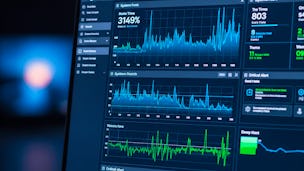
Build practical skills in modern infrastructure monitoring with Master Prometheus: Configure, Monitor & Visualize Systems. In this hands-on course, you will learn how to install and configure Prometheus, collect system and cloud metrics with exporters, deploy Alertmanager for reliable notifications, and create insightful Grafana dashboards for monitoring and visualization. You will also work with PromQL operators and functions to query time-series data, configure Pushgateway for short-lived jobs, and monitor application services with Apache Exporter.

Prometheus Monitoring: Configure & Visualize Systems

Prometheus Monitoring: Configure & Visualize Systems
This course is part of IT Infrastructure Monitoring: Prometheus, Nagios, and Zabbix Specialization

Instructor: EDUCBA
Access provided by Maritime College
Gain insight into a topic and learn the fundamentals.
12 reviews
9 hours to complete
Flexible schedule
Learn at your own pace
What you'll learn
Install Prometheus, configure exporters, and deploy Alertmanager.
Apply PromQL operators to query time-series metrics effectively.
Design Grafana dashboards to monitor apps, jobs, and cloud systems.
Details to know

Shareable certificate
Add to your LinkedIn profile
Assessments
12 assignments
Taught in English
See how employees at top companies are mastering in-demand skills

Build your subject-matter expertise
This course is part of the IT Infrastructure Monitoring: Prometheus, Nagios, and Zabbix Specialization
When you enroll in this course, you'll also be enrolled in this Specialization.
- Learn new concepts from industry experts
- Gain a foundational understanding of a subject or tool
- Develop job-relevant skills with hands-on projects
- Earn a shareable career certificate


Why people choose Coursera for their career

Felipe M.
Learner since 2018
"To be able to take courses at my own pace and rhythm has been an amazing experience. I can learn whenever it fits my schedule and mood."

Jennifer J.
Learner since 2020
"I directly applied the concepts and skills I learned from my courses to an exciting new project at work."

Larry W.
Learner since 2021
"When I need courses on topics that my university doesn't offer, Coursera is one of the best places to go."

Chaitanya A.
"Learning isn't just about being better at your job: it's so much more than that. Coursera allows me to learn without limits."
Learner reviews
- 5 stars
100%
- 4 stars
0%
- 3 stars
0%
- 2 stars
0%
- 1 star
0%
Showing 3 of 12
OS
5.0
Reviewed on Feb 17, 2026
This course provides a complete hands-on journey into Prometheus and Grafana. The step-by-step structure makes complex topics easy to follow.
SK
5.0
Reviewed on Feb 20, 2026
A very informative course that covers exporters, Alertmanager, and PromQL in a clear and applied manner. The real-world focus adds strong value.
RN
5.0
Reviewed on Apr 11, 2026
The step-by-step approach helps in setting up Prometheus quickly. Great for hands-on learners.