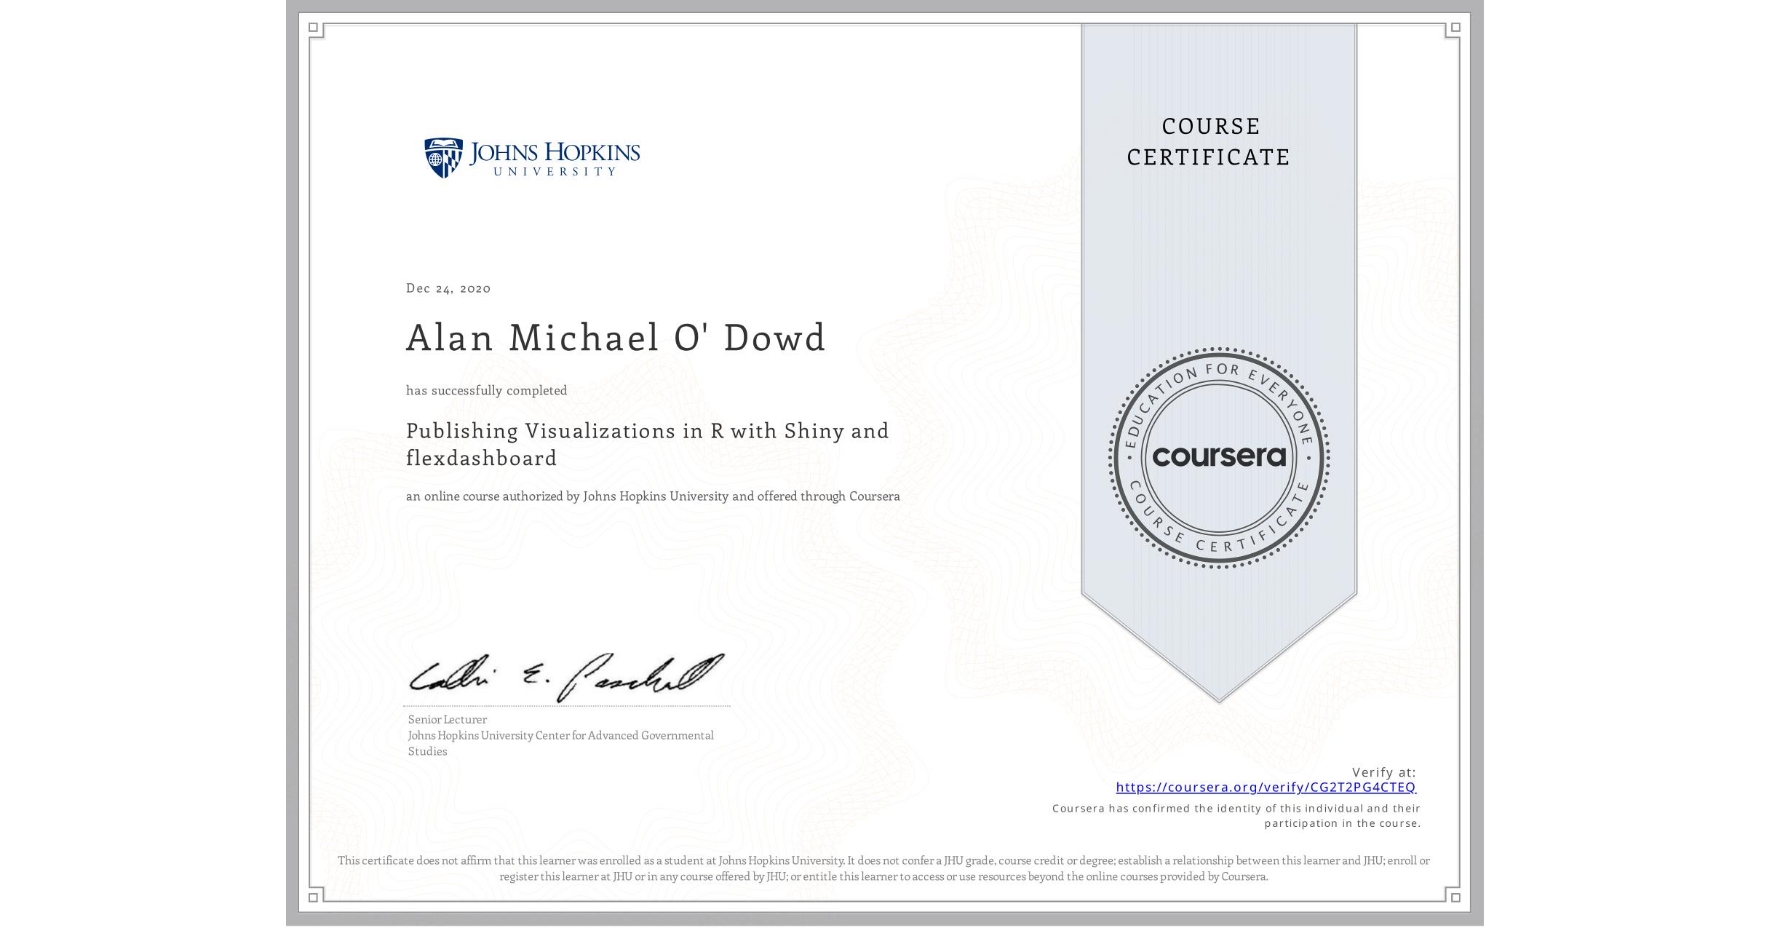
Publishing Visualizations in R with Shiny and flexdashboard
Completed by Alan Michael O' Dowd
December 24, 2020
11 hours (approximately)
Alan Michael O' Dowd's account is verified. Coursera certifies their successful completion of Publishing Visualizations in R with Shiny and flexdashboard

Skills you will gain
- Category: UI Components
- Category: Application Deployment
- Category: Dashboard
- Category: Data Sharing
- Category: Dashboard Creation
- Category: Interactive Data Visualization
- Category: User Interface (UI)
- Category: Ggplot2
- Category: Data Visualization Software
- Category: Application Development
- Category: Shiny (R Package)