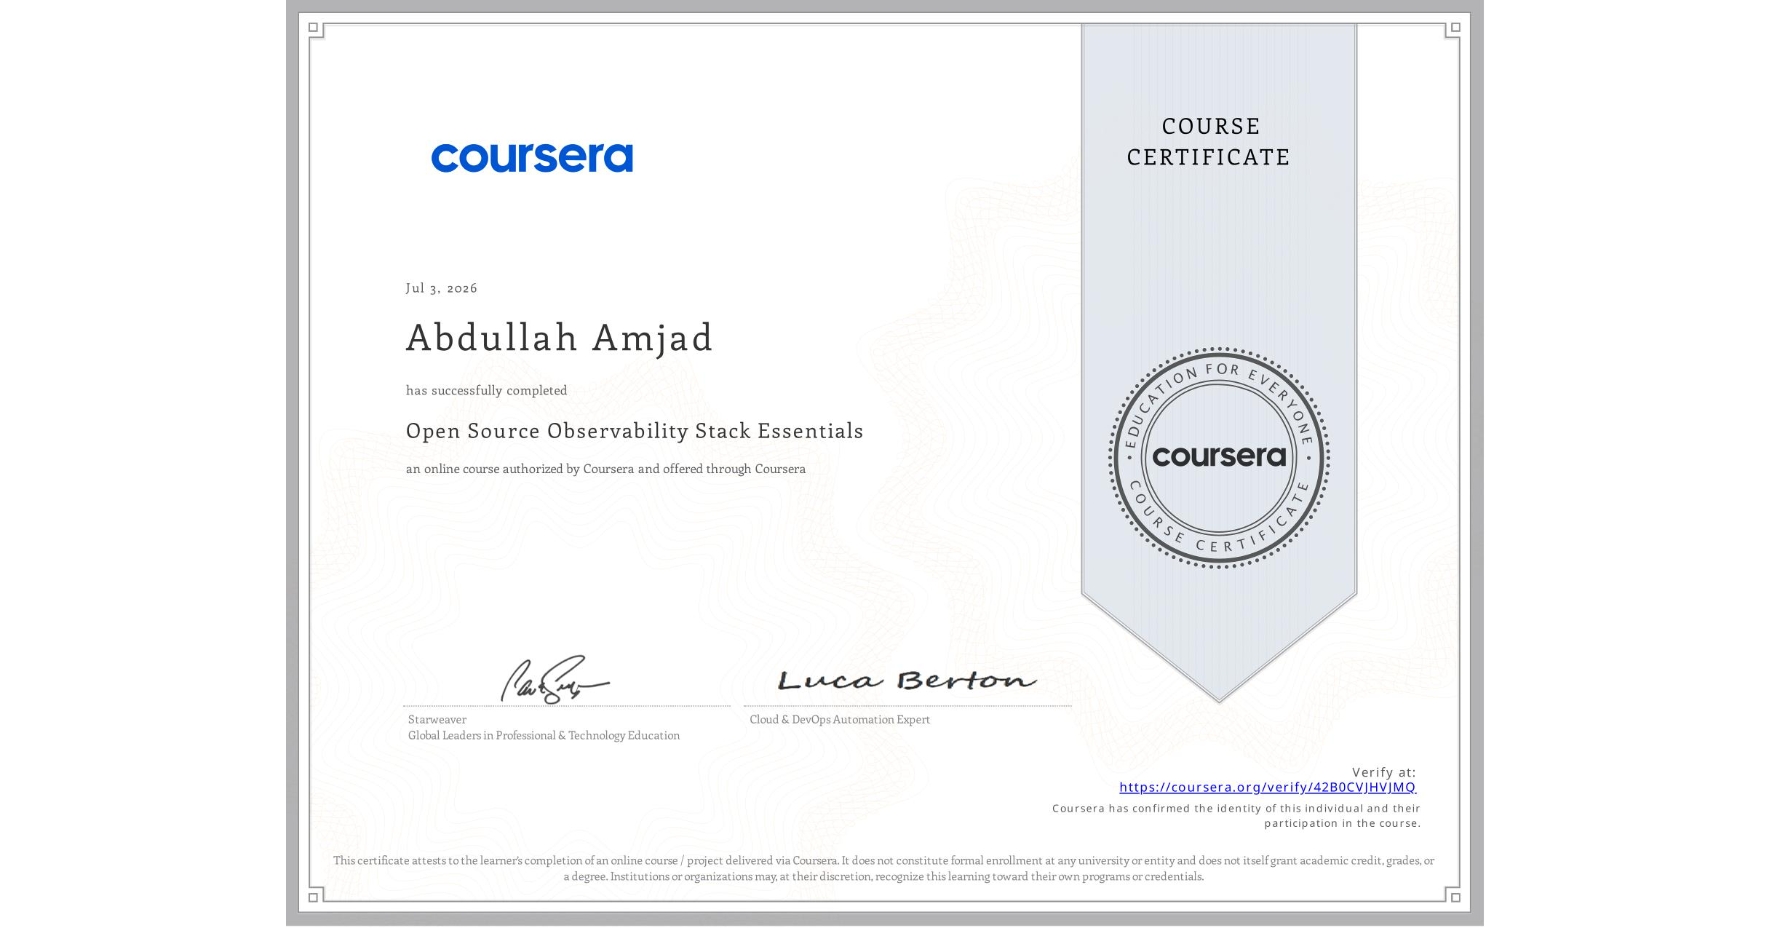
Open Source Observability Stack Essentials
Completed by Abdullah Amjad
July 3, 2026
4 hours (approximately)
Abdullah Amjad 's account is verified. Coursera certifies their successful completion of Open Source Observability Stack Essentials

What you will learn
Explain the roles of metrics, logs, and traces and map Prometheus, Grafana, and OpenTelemetry to each signal in a modern stack.
Deploy a minimal local stack (Docker or native): scrape metrics with Prometheus, route telemetry via OTel Collector, and visualize in Grafana.
Instrument a sample app with OpenTelemetry, confirm traces/metrics flow end-to-end, and build a basic Grafana dashboard.
Skills you will gain
- Category: Grafana
- Category: Site Reliability Engineering
- Category: Data Pipelines
- Category: Query Languages
- Category: Devops Tools
- Category: Dependency Analysis
- Category: Dashboard Creation
- Category: Data Storage
- Category: Prometheus (Software)
- Category: Application Performance Management
- Category: Problem Management
- Category: DevOps