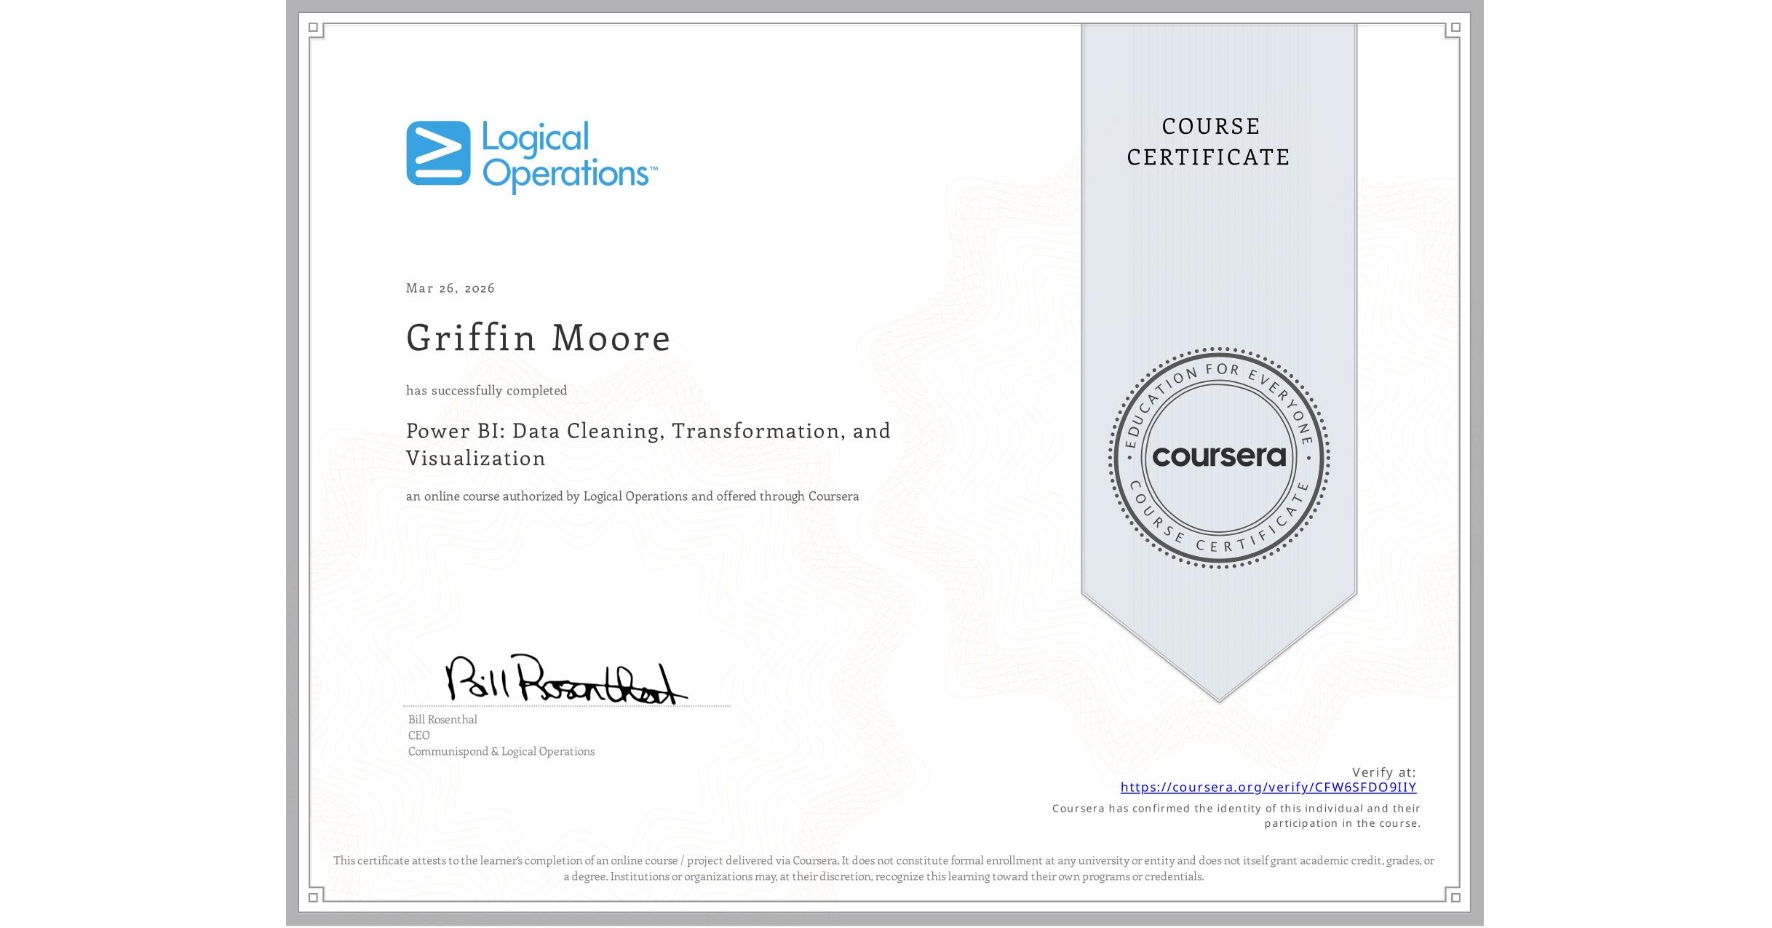
Power BI: Data Cleaning, Transformation, and Visualization
Completed by Griffin Moore
March 26, 2026
6 hours (approximately)
Griffin Moore's account is verified. Coursera certifies their successful completion of Power BI: Data Cleaning, Transformation, and Visualization

What you will learn
Clean, transform, and merge data using the Power BI Query Editor.
Create and format maps, scatter charts, and custom AppSource visuals.
Enhance report navigation using custom themes, pages, and tooltips.
Data files for this course are provided in the first course of this specialization, "Power BI: Data Analysis, Reporting, and Connecting".
Skills you will gain
- Category: Microsoft Power Platform
- Category: Business Intelligence
- Category: Microsoft Excel
- Category: Power BI
- Category: Data Quality
- Category: Data Analysis
- Category: Data Visualization
- Category: Data Visualization Software
- Category: Data Transformation
- Category: Microsoft PowerPoint
- Category: Data Wrangling
- Category: Microsoft 365