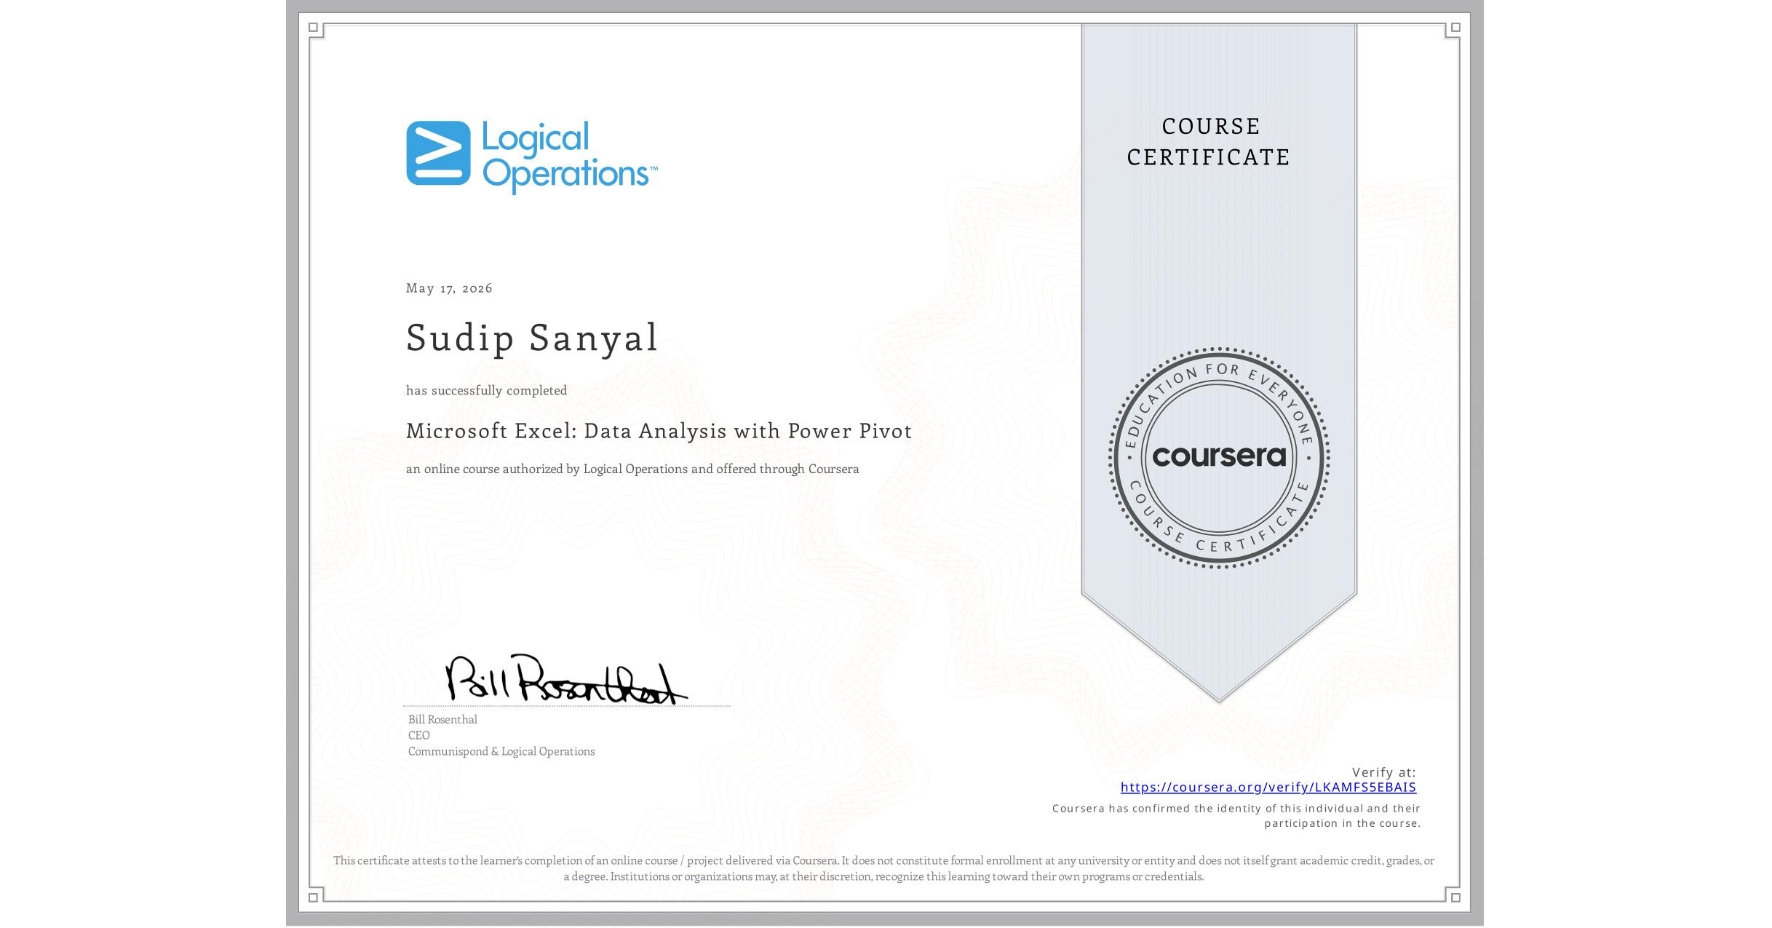
Microsoft Excel: Data Analysis with Power Pivot
Completed by SUDIP SANYAL
May 17, 2026
5 hours (approximately)
SUDIP SANYAL's account is verified. Coursera certifies their successful completion of Microsoft Excel: Data Analysis with Power Pivot

What you will learn
Import and connect massive datasets from multiple external data sources using the Excel Data Model, table relationships, and custom hierarchies.
Build sophisticated calculations and time-intelligence reports using Data Analysis Expressions (DAX) formulas to analyze date and time trends.
Design high-impact visual dashboards complete with interactive PivotTables, PivotCharts, custom Slicers, and Key Performance Indicators (KPIs).
Learn by doing. Perform guided, step-by-step hands-on activities on your own computer.
Skills you will gain
- Category: Performance Reporting
- Category: Data Visualization Software
- Category: Data Presentation
- Category: Key Performance Indicators (KPIs)
- Category: Spreadsheet Software
- Category: Performance Measurement
- Category: Microsoft Excel
- Category: Pivot Tables And Charts
- Category: Cloud-Based Integration
- Category: Trend Analysis
- Category: Data Manipulation
- Category: Data Analysis Expressions (DAX)