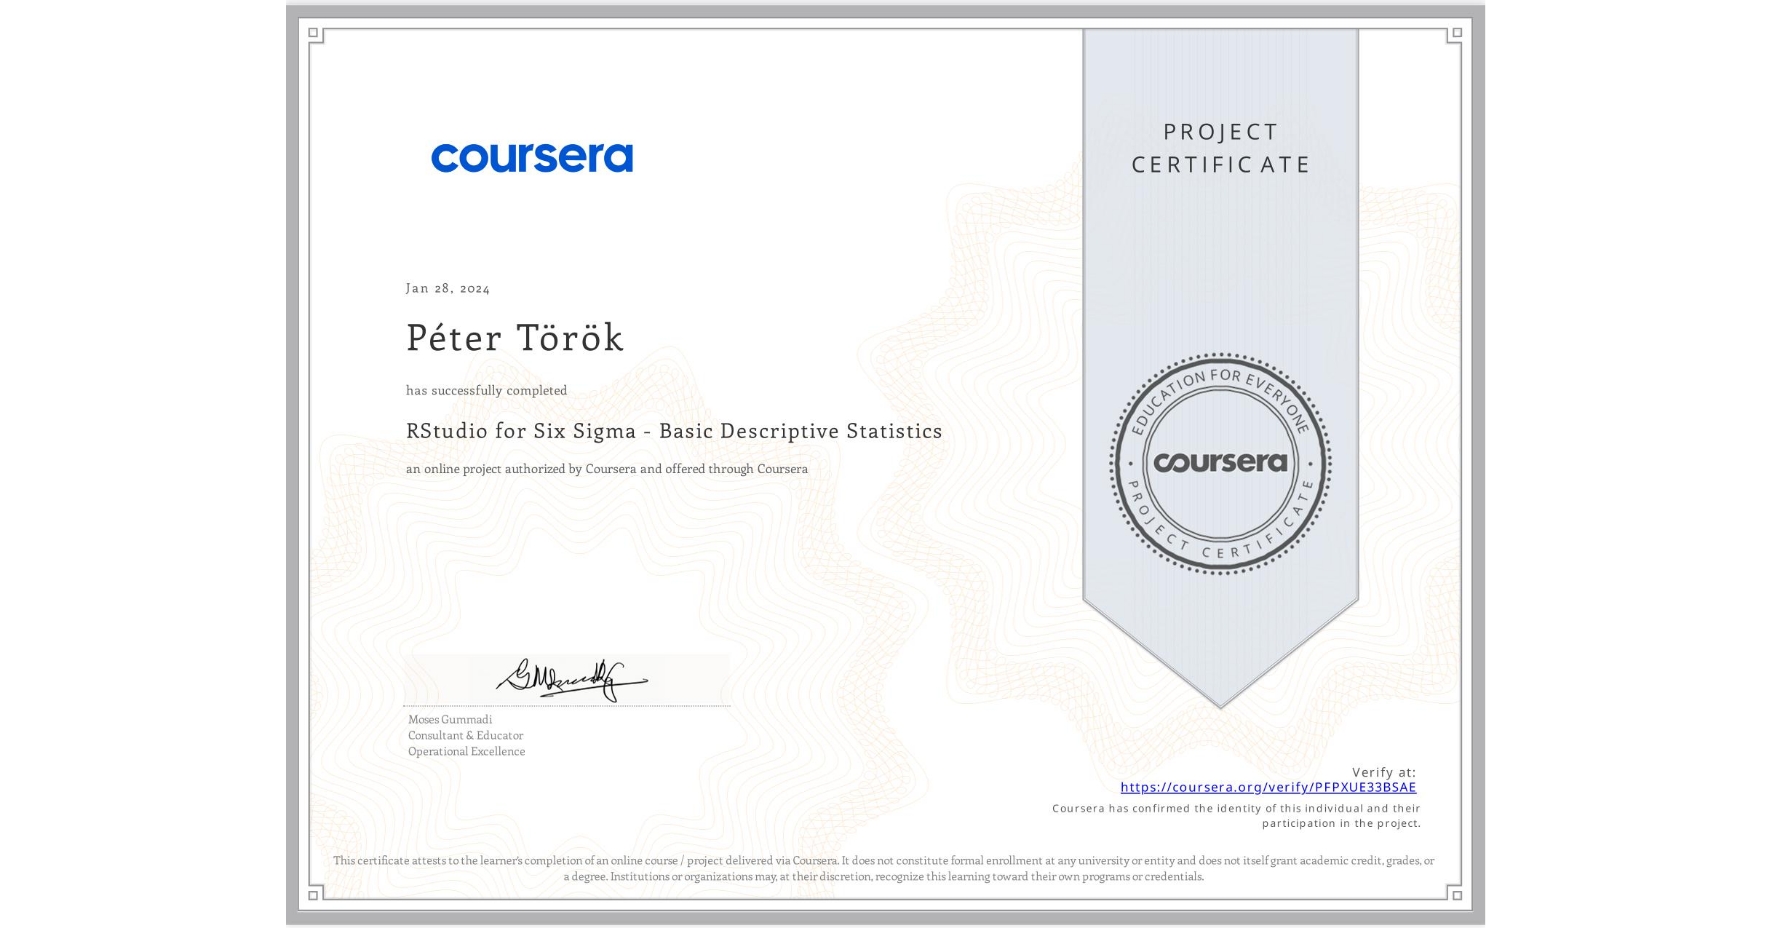
RStudio for Six Sigma - Basic Descriptive Statistics
Completed by Péter Török
January 27, 2024
2 hours (approximately)
Péter Török's account is verified. Coursera certifies their successful completion of RStudio for Six Sigma - Basic Descriptive Statistics

What you will learn
Import a real life dataset into RStudio, do some basic checks of the data frame, calculate statistics for centrality and spread.
Perform statistical sampling, plot histogram, boxplot, pareto chart, generate synthetic data according to a given statistical distribution.
And determine the fitness of a given dataset to a particular distribution.
Skills you will gain
- Category: Statistical Programming
- Category: Probability & Statistics
- Category: Statistics
- Category: Data Science
- Category: Pareto Chart
- Category: Data Synthesis
- Category: Statistical Visualization
- Category: Box Plots
- Category: Probability Distribution
- Category: Exploratory Data Analysis
- Category: Descriptive Statistics
- Category: R Programming