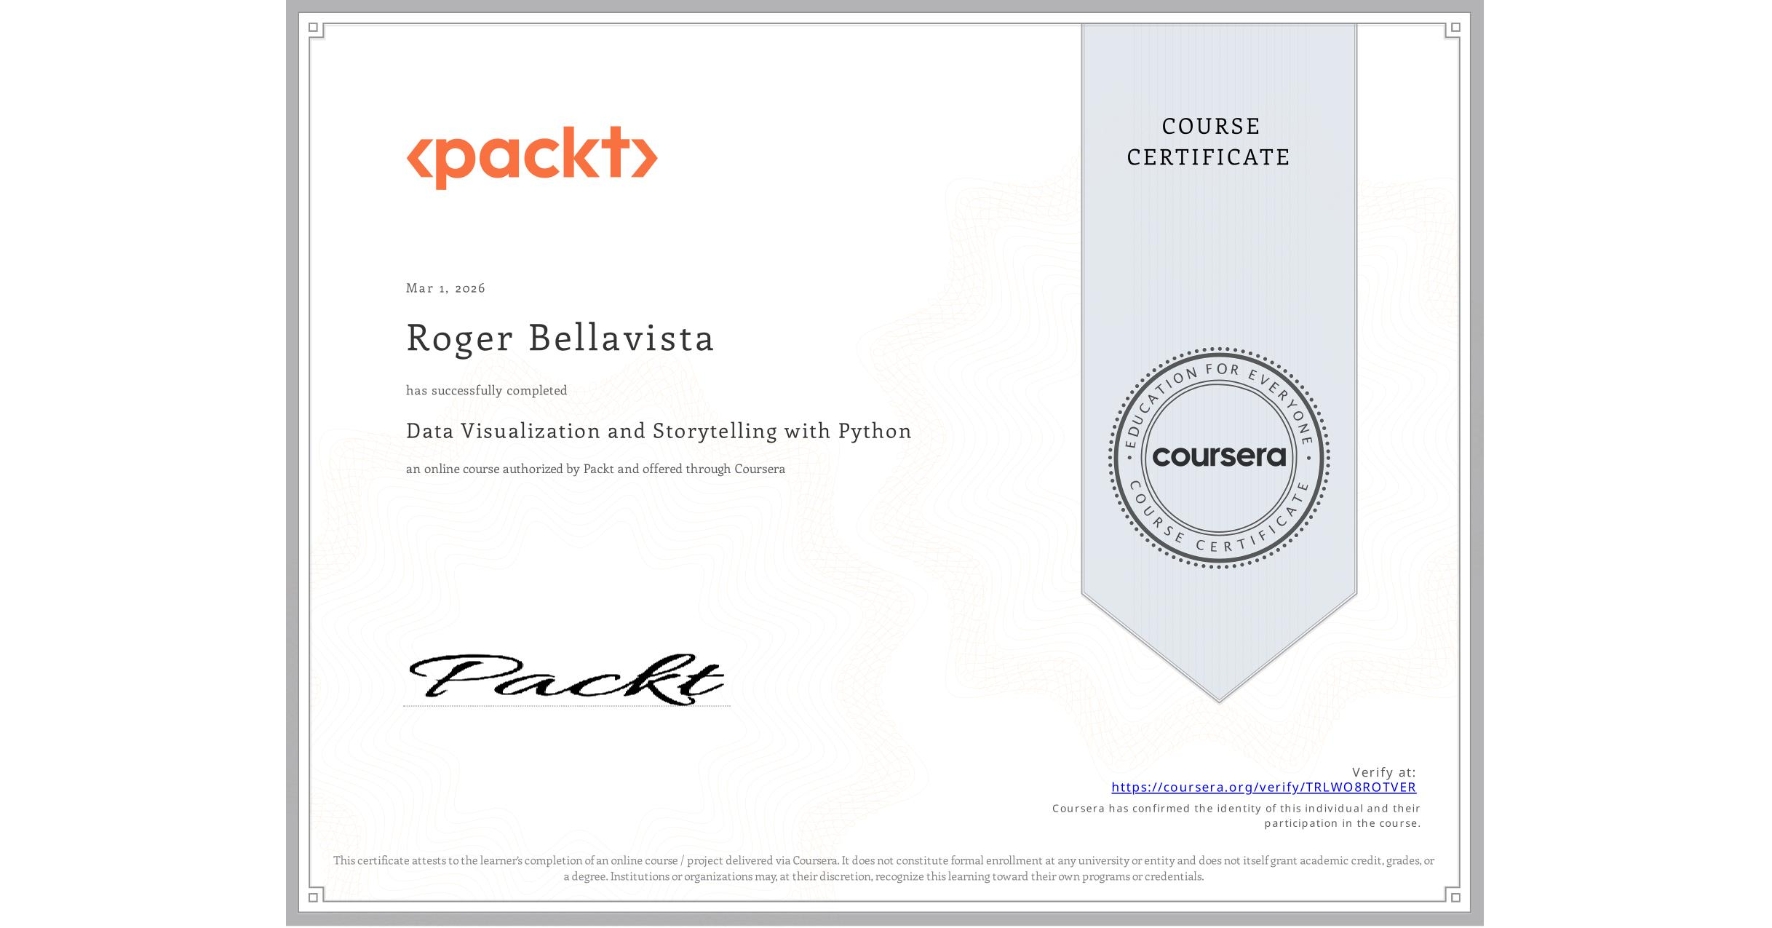
Data Visualization and Storytelling with Python
Completed by Roger Bellavista
March 1, 2026
8 hours (approximately)
Roger Bellavista's account is verified. Coursera certifies their successful completion of Data Visualization and Storytelling with Python

What you will learn
Master Python libraries like Matplotlib, Seaborn, and Plotly for data visualization.
Create interactive and 3D visualizations with Bokeh and Plotly, and geographic maps with Folium.
Apply data visualization techniques to real-world business, research, and data analysis scenarios.
Skills you will gain
- Category: Data Storytelling
- Category: Data Mapping
- Category: Plot (Graphics)
- Category: Heat Maps