
Filter by
The language used throughout the course, in both instruction and assessments.
1,051 results for "data vizualizations"
Coursera Project Network
Skills you'll gain: Data Analysis, Data Visualization, Javascript
Coursera Project Network
Skills you'll gain: Data Analysis, Data Visualization, Javascript

Google Cloud
Skills you'll gain: Cloud Computing, Cloud Infrastructure, Cloud Platforms, Computer Architecture, Computer Networking, Network Security, Cloud Standards, Continuous Integration, Interactive Data Visualization, Security Engineering
Coursera Project Network

Coursera Project Network
Skills you'll gain: Data Analysis, Data Visualization, Tableau Software

Coursera Project Network
Skills you'll gain: Python Programming

Coursera Project Network
Skills you'll gain: Data Analysis, Data Visualization, Feature Engineering, Machine Learning

Skills you'll gain: Databases, Computer Networking, Computer Architecture, Network Security, Data Analysis Software, Data Architecture, DevOps, Geometry, Security Engineering, System Software

Coursera Project Network
Skills you'll gain: Data Analysis, Data Management, Interactive Data Visualization, Tableau Software

Wesleyan University
Skills you'll gain: Computer Programming, Data Analysis, Data Management, General Statistics, Human Learning, Leadership and Management, Machine Learning, Python Programming, Regression

Imperial College London
Skills you'll gain: Computer Graphics, Computer Graphic Techniques, Visualization (Computer Graphics), Android Development, Graphic Design, Plot (Graphics), Computer Programming, Mobile Development, Linear Algebra, Visual Design, Virtual Reality

Searches related to data vizualizations
In summary, here are 10 of our most popular data vizualizations courses
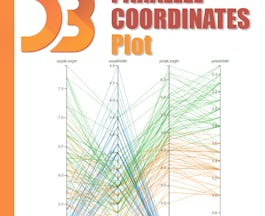
- Simple Parallel Coordinates Plot using d3 js: Coursera Project Network
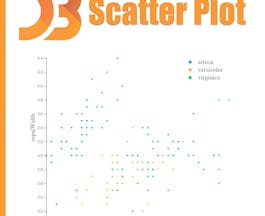
- A Simple Scatter Plot using D3 js: Coursera Project Network
- Getting Started with Google Kubernetes Engine - Português Brasileiro: Google Cloud
- Optimizing Your Google Cloud Costs 日本語版: Google Cloud
- Visualizaciones de Datos con Python utilizando Matplotlib: Coursera Project Network
- نظره عامة عن البيانات المصورة باستخدام Tableau: Coursera Project Network
- MatplotLib Python باستخدام plots إنشاء ال : Coursera Project Network
- توقع حضور المواعيد الطبية باستخدام Python: Coursera Project Network
- Architecting with Google Kubernetes Engine: Production 한국어: Google Cloud
- تصوير البيانات في تابلو: أنشئ لوحات المعلومات والقصص: Coursera Project Network


