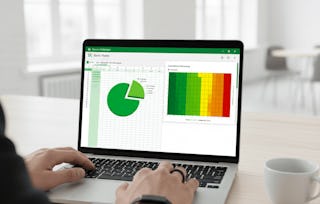
In this course, you'll continue to develop your data-analysis skills in Excel by presenting visual insights with dashboards. You'll also create geospatial visualizations in Excel.
Excel: Dashboards and Geospatial Visualizations
Économisez sur les compétences qui vous font briller avec 40 % de réduction sur 3 mois de Coursera Plus. Économisez maintenant
Excel: Dashboards and Geospatial Visualizations
Ce cours fait partie de Spécialisation "Data Analysis and Visualization with Microsoft Excel"

Instructeur : Bill Rosenthal
Inclus avec
Obtenez un aperçu d'un sujet et apprenez les principes fondamentaux.
3 heures à compléter
Planning flexible
Apprenez à votre propre rythme
Ce que vous apprendrez
In this course, you will present visual insights with dashboards and create geospatial visualizations in Excel.
Compétences que vous acquerrez
- Catégorie : Data Analysis
- Catégorie : Dashboard Creation
- Catégorie : Pivot Tables And Charts
- Catégorie : Geospatial Mapping
- Catégorie : Data Visualization Software
- Catégorie : Data Presentation
- Catégorie : Data Storytelling
- Catégorie : Interactive Data Visualization
- Catégorie : Data Visualization
- Catégorie : Spreadsheet Software
- Catégorie : Geospatial Information and Technology
Outils que vous découvrirez
- Catégorie : Dashboard
- Catégorie : Microsoft 365
- Catégorie : Microsoft Excel
- Catégorie : Microsoft Office
- Catégorie : Productivity Software
- Catégorie : Datamaps
Détails à connaître

Certificat partageable
Ajouter à votre profil LinkedIn
Récemment mis à jour !
janvier 2026
Évaluations
1 devoir
Enseigné en Anglais
Découvrez comment les employés des entreprises prestigieuses maîtrisent des compétences recherchées

Élaborez votre expertise du sujet
Ce cours fait partie de la Spécialisation "Data Analysis and Visualization with Microsoft Excel"
Lorsque vous vous inscrivez à ce cours, vous êtes également inscrit(e) à cette Spécialisation.
- Apprenez de nouveaux concepts auprès d'experts du secteur
- Acquérez une compréhension de base d'un sujet ou d'un outil
- Développez des compétences professionnelles avec des projets pratiques
- Obtenez un certificat professionnel partageable

Il y a 3 modules dans ce cours
Obtenez un certificat professionnel
Ajoutez ce titre à votre profil LinkedIn, à votre curriculum vitae ou à votre CV. Partagez-le sur les médias sociaux et dans votre évaluation des performances.
Instructeur
Offert par
En savoir plus sur Business Essentials
 Statut : Essai gratuit
 Statut : Essai gratuit
 Statut : Essai gratuit
Logical Operations
 Statut : Essai gratuit
Pour quelles raisons les étudiants sur Coursera nous choisissent-ils pour leur carrière ?

Felipe M.
Étudiant(e) depuis 2018
’Pouvoir suivre des cours à mon rythme à été une expérience extraordinaire. Je peux apprendre chaque fois que mon emploi du temps me le permet et en fonction de mon humeur.’

Jennifer J.
Étudiant(e) depuis 2020
’J'ai directement appliqué les concepts et les compétences que j'ai appris de mes cours à un nouveau projet passionnant au travail.’

Larry W.
Étudiant(e) depuis 2021
’Lorsque j'ai besoin de cours sur des sujets que mon université ne propose pas, Coursera est l'un des meilleurs endroits où se rendre.’

Chaitanya A.
’Apprendre, ce n'est pas seulement s'améliorer dans son travail : c'est bien plus que cela. Coursera me permet d'apprendre sans limites.’


Foire Aux Questions
Plus de questions
Aide financière disponible,