Lorsque vous vous inscrivez à ce cours, vous êtes également inscrit(e) à cette Spécialisation.
Apprenez de nouveaux concepts auprès d'experts du secteur
Acquérez une compréhension de base d'un sujet ou d'un outil
Développez des compétences professionnelles avec des projets pratiques
Obtenez un certificat professionnel partageable
Il y a 4 modules dans ce cours
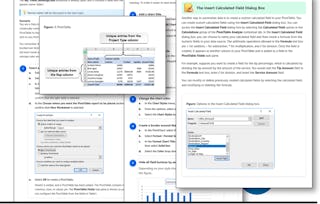
We are now living in the age of big data. Data is being collected all the time and for increasingly detailed transactions. This can lead to an overwhelming amount of data, which brings about a need for people who can analyze large amounts of data quickly. Fortunately, Microsoft® Excel® provides Power Pivot to help you organize, manipulate, and report on your data in the best way possible. Since a tool is only as good as the person using it, it is important to gain a solid understanding of Power Pivot to maximize your effectiveness when analyzing data.
This material will benefit users of any current Office version. The course environment setup is based on Excel for Office 365.
Students taking this course are experienced Excel users who are seeking to advance their data-analysis capabilities by using Power Pivot.
In this course, you will: get started with Power Pivot, visualize Power Pivot data, and work with advanced functionality in Power Pivot.
This course requires that you have Microsoft Excel installed on a Windows PC. The course setup instructions provided in the first module of the course go into more detail about the hardware and software requirements.
Today's business-intelligence tasks require that you process internal and external data from a wide variety of sources, including the cloud, data services, sales automation tools, Customer Relationship Management systems, and so forth. While there are dedicated business-intelligence applications, many organizations are finding that many of their needs are met using tools provided in Microsoft® Office. You may already use Microsoft® Excel® PivotTables and PivotCharts to create your own reports and data dashboards, but you may have experienced some of Excel's limitations, such as the amount of data you can process and what you can do with data from different sources. Power Pivot overcomes many of these limitations, enabling you to create more sophisticated models and perform powerful data analysis right within the Excel interface. To get started using Power Pivot with Excel, there are some setup tasks you need to perform.
Inclus
6 plugins
Afficher les informations sur le contenu du module
6 plugins•Total 100 minutes
Getting Started with This Course•20 minutes
Lesson Introduction•5 minutes
Enable and Navigate Power Pivot•30 minutes
Manage Data Relationships•30 minutes
Mastery Builder: Getting Started with Power Pivot•10 minutes
Lesson Summary•5 minutes
Visualizing Power Pivot Data
Module 2•2 heures à terminer
Détails du module
Now that you have Power Pivot enabled and have worked with the Data Model, you are ready to visualize your Power Pivot data into reports such as tables and charts. This enables you to organize data for easier analysis. Once you have created a report, you may realize that you want to view information in a specific way that you don't readily have available in your data. Usually, though, you already have the pieces you need and they just need to be manipulated in a different way. This is where calculations are useful. By using the data you already have and applying calculations to it, you can add data to the Data Model to enhance your reports.
Inclus
5 plugins
Afficher les informations sur le contenu du module
5 plugins•Total 95 minutes
Lesson Introduction•5 minutes
Create a Power Pivot Report•30 minutes
Create Calculations in Power Pivot•30 minutes
Mastery Builder: Visualizing Power Pivot Data•15 minutes
Lesson Summary•15 minutes
Working with Advanced Functionality in Power Pivot
Module 3•2 heures à terminer
Détails du module
Now that you have created a report from your Power Pivot data and created basic calculations for use in PivotTables, you are ready to work with more advanced functionality. Often when you analyze data, you are measuring performance by comparing it to some sort of goal or target. Additionally, you are often comparing data over time to measure performance or to find trends. Can Microsoft® Excel® help you with these tasks? Fortunately, Power Pivot includes specific functionalities to help you measure performance and analyze data over time.
Inclus
5 plugins
Afficher les informations sur le contenu du module
5 plugins•Total 95 minutes
Lesson Introduction•5 minutes
Create a KPI•30 minutes
Work with Dates and Time in Power Pivot•30 minutes
Mastery Builder: Working with Advanced Functionality in Power Pivot•15 minutes
Lesson Summary•15 minutes
Completing the Course
Module 4•1 heure à terminer
Détails du module
You'll wrap things up and then validate what you've learned in this course by taking an assessment.
Inclus
1 devoir2 plugins
Afficher les informations sur le contenu du module
1 devoir•Total 10 minutes
Course Assessment•10 minutes
2 plugins•Total 25 minutes
Appendices•10 minutes
Course Summary•15 minutes
Obtenez un certificat professionnel
Ajoutez ce titre à votre profil LinkedIn, à votre curriculum vitae ou à votre CV. Partagez-le sur les médias sociaux et dans votre évaluation des performances.
Logical Operations is the world's largest general publisher of instructor-led technology curriculum, and a leader in the technical training community for over 40 years. We employ a rigorous, expert-driven authoring process that, for decades, has produced successful results for learners the world over. Our courseware aligns with real-world business needs and objectives, ensuring learners are able to apply their newly developed skills while on the job.
Pour quelles raisons les étudiants sur Coursera nous choisissent-ils pour leur carrière ?
Felipe M.
Étudiant(e) depuis 2018
’Pouvoir suivre des cours à mon rythme à été une expérience extraordinaire. Je peux apprendre chaque fois que mon emploi du temps me le permet et en fonction de mon humeur.’
Jennifer J.
Étudiant(e) depuis 2020
’J'ai directement appliqué les concepts et les compétences que j'ai appris de mes cours à un nouveau projet passionnant au travail.’
Larry W.
Étudiant(e) depuis 2021
’Lorsque j'ai besoin de cours sur des sujets que mon université ne propose pas, Coursera est l'un des meilleurs endroits où se rendre.’
Chaitanya A.
’Apprendre, ce n'est pas seulement s'améliorer dans son travail : c'est bien plus que cela. Coursera me permet d'apprendre sans limites.’
When will I have access to the lectures and assignments?
To access the course materials, assignments and to earn a Certificate, you will need to purchase the Certificate experience when you enroll in a course. You can try a Free Trial instead, or apply for Financial Aid. The course may offer 'Full Course, No Certificate' instead. This option lets you see all course materials, submit required assessments, and get a final grade. This also means that you will not be able to purchase a Certificate experience.
What will I get if I subscribe to this Specialization?
When you enroll in the course, you get access to all of the courses in the Specialization, and you earn a certificate when you complete the work. Your electronic Certificate will be added to your Accomplishments page - from there, you can print your Certificate or add it to your LinkedIn profile.
Is financial aid available?
Yes. In select learning programs, you can apply for financial aid or a scholarship if you can’t afford the enrollment fee. If fin aid or scholarship is available for your learning program selection, you’ll find a link to apply on the description page.