PP
5.0Reviewed Sep 12, 2021
Great interactive project that is beginner-friendly and insightful. Datasets are also very interesting.
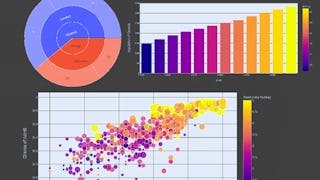
In this hands-on project, we will understand the fundamentals of interactive data visualization using Plolty Express. Plotly Express is a powerful Python package that empowers anyone to create, manipulate and render graphical figures with very few lines of code. Plotly Express is the recommended entry-point into the plotly package. We will leverage Plotly Express to generate interactive single Line plots, multiple line plots, histograms, pie charts, scatterplots, bubble charts, and bar charts. Note: This course works best for learners who are based in the North America region. We’re currently working on providing the same experience in other regions.
PP
Great interactive project that is beginner-friendly and insightful. Datasets are also very interesting.
RS
Very slow cloud based environment, thus downloaded and configured locally.
Showing: 3 of 3
I've completed alot of project courses related to programming. This instructor is my #1 favorite. The content is easy to follow, the pace is great, the amount of time allocated to each task is long enough so that it doesn't feel rushed or oversimplified, and I like that a well laid out notebook file is provided. I also had no issues following along using my own PC vs the Rhyme side-by-side. My only piece of negative feedback is that the first few mini-challenges task you with adding code that is not taught within the class (i.e. you would have to research it) which is not an effective way to learn in my opinion. Fortunately, you can just skip this and wait for the instructor to teach you the answers. The subsequent challenges focus only on reinforcing content that was directly taught to you which is the way it should be.
Great interactive project that is beginner-friendly and insightful. Datasets are also very interesting.
Very slow cloud based environment, thus downloaded and configured locally.