5.0
Reviewed Jan 8, 2026The best course I’ve taken in years ,The instructor’s expertise really shows, and the lessons were both interesting and useful.

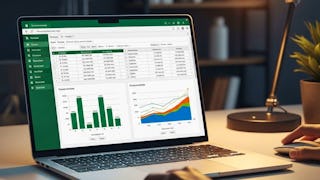
Master Data Analysis with Pivot Tables: Build, Analyze & Automate teaches you how to transform raw Excel data into meaningful insights using pivot tables, pivot charts, advanced calculations, and automation. Through a structured, step-by-step learning experience, you'll progress from understanding the fundamentals of pivot tables to applying advanced analytical features that improve reporting and decision-making. You will learn how to build and format pivot tables, sort and filter data, group numeric and date fields, and use advanced features such as Show Details, grand total settings, and Show Values As to interpret results more effectively. As you advance, you'll create pivot charts, compare chart types for different reporting needs, implement calculated fields, protect pivot reports, and automate repetitive workflows using macros. This course is designed for learners who want to strengthen their Excel data analysis skills through practical, hands-on learning. Its unique approach combines foundational concepts with advanced pivot table techniques, helping you develop both analytical and reporting capabilities. By the end of the course, you'll be able to organize, analyze, visualize, and automate Excel-based reports with greater speed, accuracy, and confidence, making your data easier to understand and communicate.
The best course I’ve taken in years ,The instructor’s expertise really shows, and the lessons were both interesting and useful.
This course was easy to understand and very informative.
This course helped me improve fast! Very well structured and engaging I can already apply what I learned.
Outstanding instruction and great content I would recommend this to anyone wanting to grow their skills.
This course gave me exactly what I was looking for clear explanations, real-world examples, and a friendly pace. Great for beginners and even intermediate learners. Loved every module.
This course was outstanding! The lessons are clear, the instructor explains even complex topics in a simple way, and the hands-on projects really helped me improve my skills. Highly recommend.
One of the best courses I’ve taken online! The instructor was knowledgeable and explained topics clearly.
This course was exactly what I needed. The lessons were thorough, and I could easily go at my own pace.
Outstanding course! The instructor’s explanations were clear and detailed.
Highly educational and engaging The instructor was clear and supportive, which made learning really enjoyable.
I appreciated how each module connected to the next.
Outstanding instruction and great content! I would recommend this to anyone wanting to grow their skills.
Showing: 20 of 27
This course completely exceeded my expectations! The content was well-structured, and the real-world examples helped me apply what I learned immediately. The instructors were knowledgeable and always available to answer questions. Highly recommend to anyone serious about advancing their skills.
I really enjoyed this course and found it very useful. The lessons were clear, practical, and well-structured. The instructor explained concepts in a simple and effective way. This course helped me improve my skills and knowledge. I would highly recommend it to anyone interested in this field.
I had a wonderful learning experience with this course. The lessons were organized logically, allowing me to build my understanding step by step. The instructor’s teaching style was clear, patient, and motivating.
This course was outstanding! The lessons are clear, the instructor explains even complex topics in a simple way, and the hands-on projects really helped me improve my skills. Highly recommend.
This course gave me exactly what I was looking for clear explanations, real-world examples, and a friendly pace. Great for beginners and even intermediate learners. Loved every module.
Highly recommend this course, It’s informative, interactive, and well-designed. I finished it feeling inspired and confident to apply my new skills in real projects.
Great course with actionable lessons! It’s clear a lot of thought went into the curriculum. This helped me improve quickly and effectively.
The best course I’ve taken in years ,The instructor’s expertise really shows, and the lessons were both interesting and useful.
This course exceeded my expectations. The curriculum was thoughtfully designed and covered all the important topics in depth.
Highly educational and engaging The instructor was clear and supportive, which made learning really enjoyable.
This course helped me improve fast! Very well structured and engaging I can already apply what I learned.
Outstanding instruction and great content! I would recommend this to anyone wanting to grow their skills.
One of the best courses I’ve taken online! The instructor was knowledgeable and explained topics clearly.
Outstanding instruction and great content I would recommend this to anyone wanting to grow their skills.
This course was exactly what I needed. The lessons were thorough, and I could easily go at my own pace.
Excellent course. Well organized with helpful resources and real-world applications.
Outstanding course! The instructor’s explanations were clear and detailed.
This course was easy to understand and very informative.
I appreciated how each module connected to the next.
I had a great experience with this course.