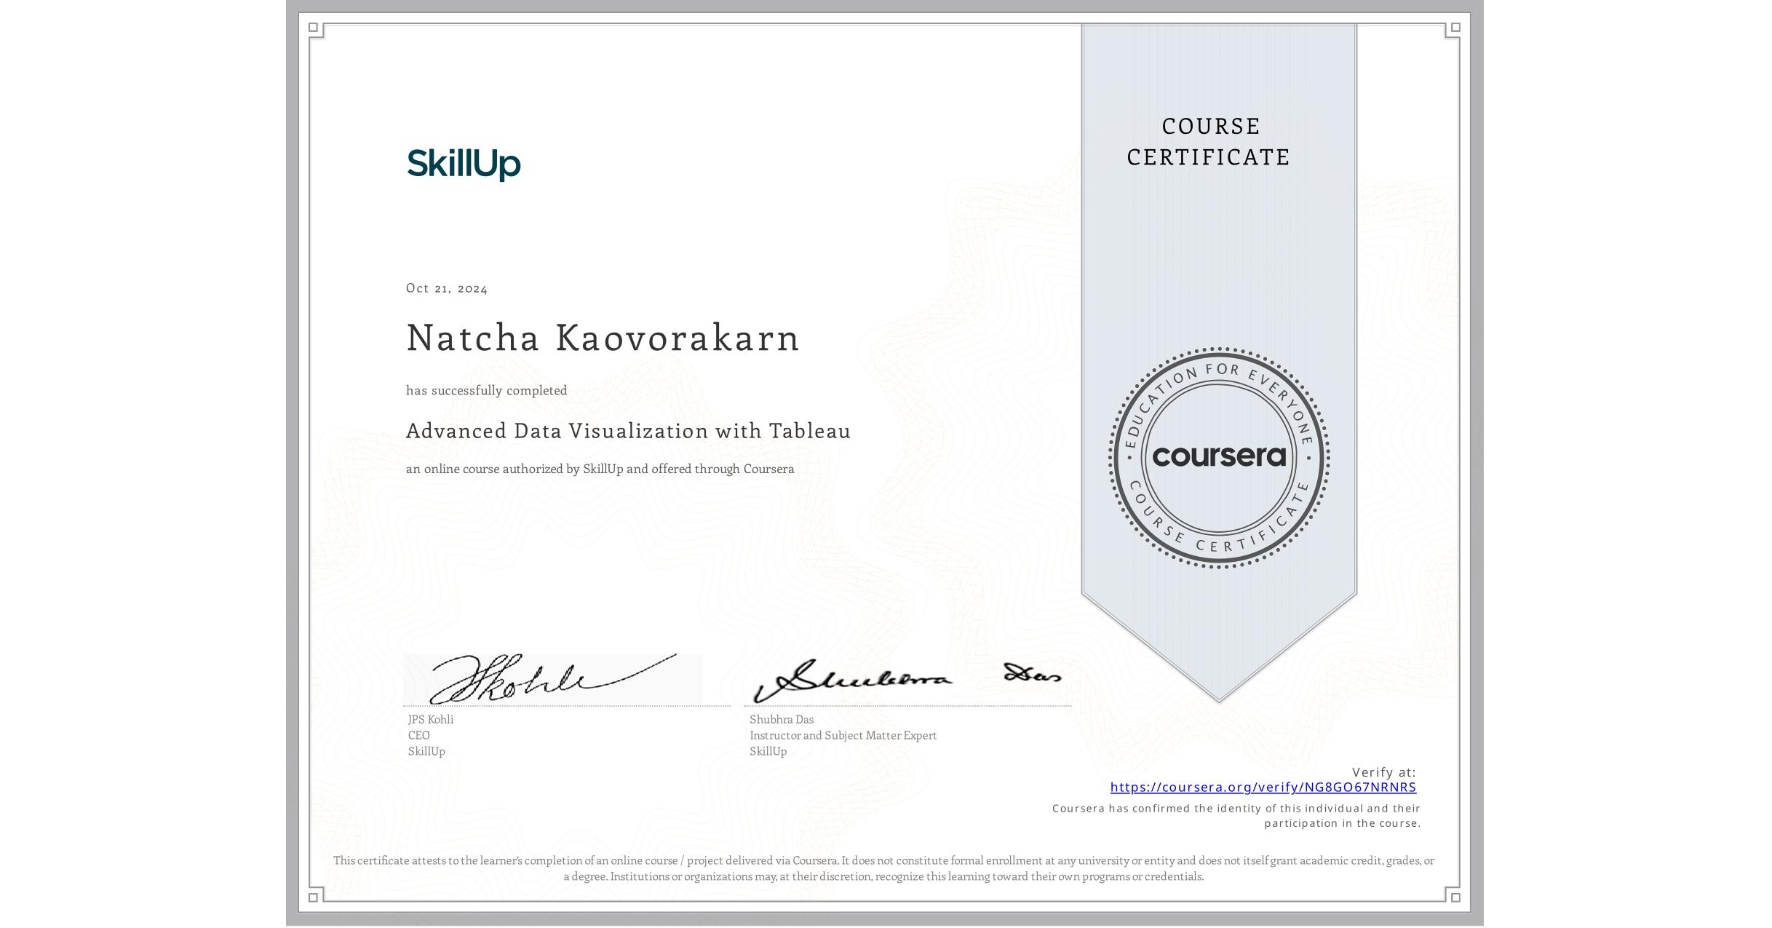
Advanced Data Visualization with Tableau
Completed by Natcha Kaovorakarn
October 21, 2024
11 hours (approximately)
Natcha Kaovorakarn's account is verified. Coursera certifies their successful completion of Advanced Data Visualization with Tableau

What you will learn
Apply advanced techniques to create interactive and dynamic visualizations in Tableau, demonstrating high proficiency in data presentation
Create interactive dashboards in Tableau, incorporating navigation, links between story points, and advanced features such as actions and tooltips
Demonstrate a comprehensive understanding of Tableau's capabilities and features such as advanced formatting, dashboard design and web objects
Effectively use Tableau’s features to deliver insightful dashboards and stories for data exploration and monitoring
Skills you will gain
- Category: Data Modeling
- Category: Data Integration
- Category: Data Analysis
- Category: Data Access
- Category: Advanced Analytics
- Category: Tableau Software
- Category: Dashboard
- Category: Data Presentation
- Category: Model Optimization
- Category: Data Visualization
- Category: Interactive Data Visualization
- Category: Dashboard Creation