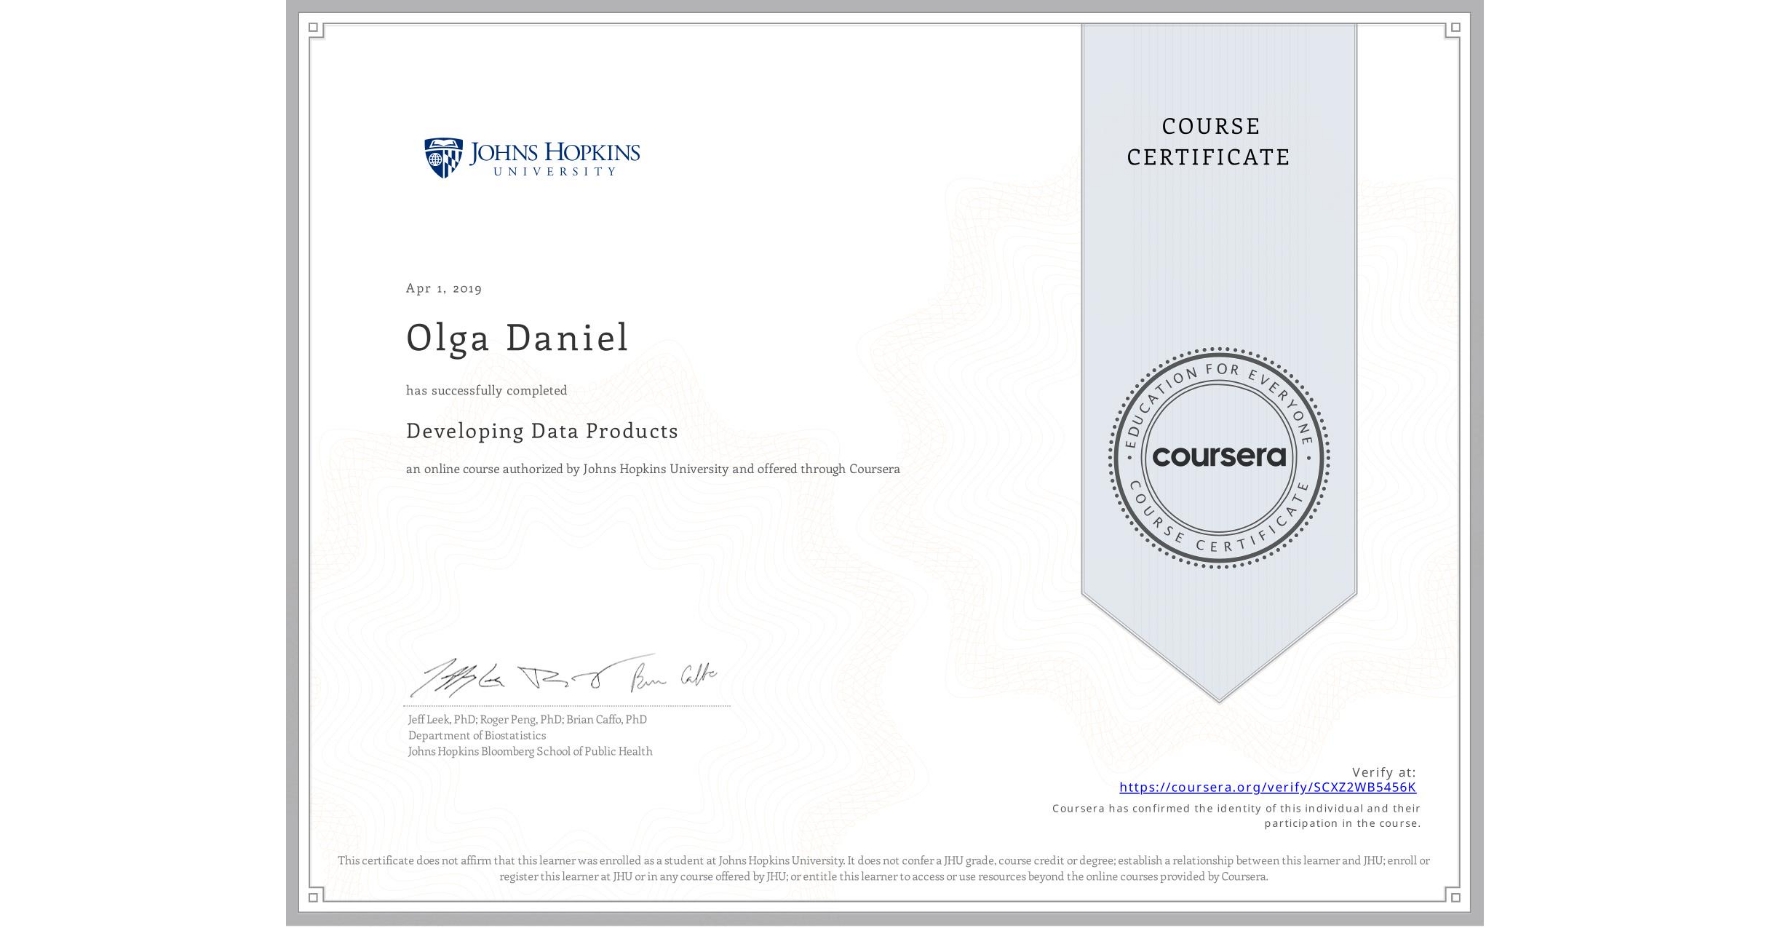
Developing Data Products
Completed by Olga Daniel
April 1, 2019
10 hours (approximately)
Olga Daniel's account is verified. Coursera certifies their successful completion of Developing Data Products

What you will learn
Develop basic applications and interactive graphics using GoogleVis
Use Leaflet to create interactive annotated maps
Build an R Markdown presentation that includes a data visualization
Create a data product that tells a story to a mass audience
Skills you will gain
- Category: Web Applications
- Category: Data Presentation
- Category: Package and Software Management
- Category: Application Development
- Category: Interactive Data Visualization
- Category: Hypertext Markup Language (HTML)
- Category: R Programming
- Category: R (Software)
- Category: Data Visualization Software
- Category: Software Documentation
- Category: Statistical Reporting
- Category: Plotly