Results for "creating charts"
 Status: Free Trial
Intuit
Skills you'll gain: Bookkeeping, QuickBooks (Accounting Software), Financial Statements, Accounting Software, Financial Accounting, Ledgers (Accounting), Accounting, Accounting Records, Balance Sheet, Income Statement, General Ledger, Small Business Accounting, Ethical Standards And Conduct, Cash Flows
 Status: NewStatus: Free Trial
Logical Operations
Skills you'll gain: Microsoft Excel, Pivot Tables And Charts, Spreadsheet Software, Excel Formulas, Data Presentation, Data Visualization Software, Data Analysis, Microsoft Office, Microsoft 365, Data Entry, Data Manipulation, Productivity Software, Data Management, Document Management, User Interface (UI)
 Status: NewStatus: Free Trial
Logical Operations
Skills you'll gain: Excel Formulas, Pivot Tables And Charts, Microsoft Excel, Spreadsheet Software, Data Validation, Data Visualization, Data Analysis, Interactive Data Visualization, Productivity Software, Data Integrity, Microsoft Office, Microsoft 365
 Status: Free Trial
Skills you'll gain: React Native, Jest (JavaScript Testing Framework), Version Control, User Research, Usability Testing, Unix Commands, Restful API, Git (Version Control System), Persona (User Experience), GitHub, Interaction Design, User Experience Design, SQL, User Interface (UI), User Experience, Mobile Development, Design Research, React.js, Web Development Tools, Javascript
 Status: Free Trial
Skills you'll gain: Media Planning, Spreadsheet Software, A/B Testing, Return On Investment, Marketing Analytics, Key Performance Indicators (KPIs), Google Analytics, Pivot Tables And Charts, Performance Measurement, Performance marketing, Digital Marketing, Data Presentation, Google Ads, Marketing Budgets, Marketing, Web Analytics and SEO, Data Analysis, Stakeholder Communications
 Status: Free Trial
University of Illinois Urbana-Champaign
Skills you'll gain: Business Strategy, Organizational Change, Stakeholder Management, Organizational Structure, Corporate Strategy, Governance, Conflict Management, Organizational Strategy, Trustworthiness, Team Building, Strategic Leadership, Organizational Leadership, Management Training And Development, Business Management, Organizational Effectiveness, Business Ethics, Team Management, Leadership Development, Leadership, Negotiation
 Status: Free Trial
Rice University
Skills you'll gain: Statistical Hypothesis Testing, Microsoft Excel, Statistical Methods, Pivot Tables And Charts, Regression Analysis, Statistics, Descriptive Statistics, Probability & Statistics, Graphing, Spreadsheet Software, Probability Distribution, Business Analytics, Statistical Modeling, Statistical Analysis, Statistical Inference, Excel Formulas, Data Analysis, Data Presentation, Model Evaluation, Sample Size Determination
 Status: Free Trial
Macquarie University
Skills you'll gain: Pivot Tables And Charts, Data Storytelling, Power BI, Microsoft Excel, Excel Formulas, Data Presentation, Data Visualization Software, Data Visualization, Interactive Data Visualization, Spreadsheet Software, Dashboard, Data Cleansing, Data Manipulation, Data Preprocessing, Excel Macros, Infographics, Data Transformation, Data Analysis, Data Sharing, Data Integration
 Status: Free Trial
Rice University
Skills you'll gain: Microsoft Excel, Pivot Tables And Charts, Graphing, Spreadsheet Software, Excel Formulas, Data Analysis, Histogram, Scatter Plots, Data Visualization Software, Data Manipulation, Data Import/Export
 Status: NewStatus: Free Trial
Knowledge Accelerators
Skills you'll gain: Power BI, Data Presentation, Microsoft Excel, Dashboard, Excel Formulas, Data Modeling, Business Reporting, Data Entry, Data Analysis, Data Storytelling, Data-Driven Decision-Making, Business Analytics, Analytics, Business Modeling, Data Processing, Business Analysis, Data Cleansing, Data Synthesis, Trend Analysis, Data Management
 Status: Free Trial
Skills you'll gain: Responsive Web Design, Web Design, User Experience Design, Design Reviews, Wireframing, Usability Testing, User Research, User Interface (UI) Design, Prototyping, User Flows, Figma (Design Software), Information Architecture
 Status: NewStatus: Free Trial
Skills you'll gain: MLOps (Machine Learning Operations), Model Evaluation, Version Control, Large Language Modeling, Git (Version Control System), Data Management, Performance Testing, Dashboard, Machine Learning, Scripting, Performance Analysis, Technical Documentation
Searches related to creating charts
In summary, here are 10 of our most popular creating charts courses
- Bookkeeping basics: Intuit
- Microsoft Excel for Office 365 (Desktop or Online): Part 2: Logical Operations
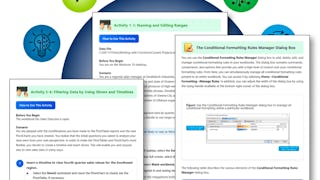
- Excel: Data Analysis with Formulas/Functions and PivotTables: Logical Operations
- Meta React Native: Meta
- Assess for Success: Marketing Analytics and Measurement: Google
- Strategic Leadership and Management: University of Illinois Urbana-Champaign
- Business Statistics and Analysis: Rice University
- Excel Skills for Data Analytics and Visualization: Macquarie University
- Introduction to Data Analysis Using Excel: Rice University
- Excel to Power BI: Data Analysis & Business Intelligence: Knowledge Accelerators


