Results for "interactive visualization"
 Status: NewStatus: Free Trial
Skills you'll gain: Excel Macros, Data Validation, Pivot Tables And Charts, Microsoft Excel, Data Visualization, Scatter Plots, Histogram, Data Integrity, Excel Formulas, Spreadsheet Software, Forecasting, Data Analysis, Debugging, Visual Basic (Programming Language), Automation
 Status: Free Trial
University of Michigan
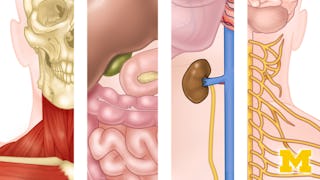
Skills you'll gain: Human Musculoskeletal System, Anatomy, Endocrinology, Pulmonology, Cardiology, Respiration, Gynecology, Hematology, Obstetrics And Gynecology, Orthopedics, Neurology, Urology, Nephrology, Kinesiology, Physiology, Medical Imaging, Sports Medicine, Biology, Medical Terminology, Cell Biology
 Status: Free Trial
Macquarie University
Skills you'll gain: Excel Formulas, Microsoft Excel, Data Cleansing, Data Manipulation, Data Preprocessing, Spreadsheet Software, Data Transformation, Data Validation, Data Analysis, Pivot Tables And Charts, Automation
 Status: Preview
University of Minnesota
Skills you'll gain: Health Informatics, Health Technology, Telehealth, Interoperability, Clinical Informatics, Electronic Medical Record, Health Care, Health Information Management, Community Health, Healthcare Ethics, Dental Informatics, Public Health, Data Ethics, Geospatial Information and Technology, Data Visualization, Graph Theory
 Status: Free Trial
Microsoft
Skills you'll gain: Data Storytelling, Power BI, Data Presentation, Dashboard, Data Visualization Software, Data Visualization, Report Writing, Multimedia, Data Analysis, Creative Design, Management Reporting, Data Mapping, Data Security, Key Performance Indicators (KPIs), Target Audience
Skills you'll gain: Google Sheets, Data Visualization, Spreadsheet Software, Data Presentation, Data Analysis, Data Visualization Software, Business Analytics, Productivity Software, Business Analysis, Data Manipulation, Descriptive Statistics, Analysis, Statistics, Excel Formulas, Data Cleansing, Mathematical Software
 Status: Preview
University of Amsterdam
Skills you'll gain: Lean Six Sigma, Statistical Hypothesis Testing, Minitab, Regression Analysis, Data Visualization Software, Probability Distribution, Data Analysis, Histogram, Statistical Analysis, Box Plots, Process Improvement, Logistic Regression, Statistics, Variance Analysis
 Status: New
Skills you'll gain: Technical Documentation, Technical Writing, Software Documentation, Technical Communication, Software Design Documents, Information Architecture, Writing, User Requirements Documents, Software Development Tools, Automation, Style Guides, Software Development, Agile Software Development, Interactive Design, Project Management Software, Diagram Design, Generative AI
 Status: Free Trial
University of Illinois Urbana-Champaign
Skills you'll gain: 3D Modeling, Design Thinking, Autodesk, Design Software, 3D Assets, Creative Thinking, Intellectual Property, Conceptual Design, Hardware Troubleshooting, Computer-Aided Design, Visualization (Computer Graphics), Product Design, Computer Hardware, Innovation, Solution Design, Manufacturing Processes, Computer Graphics, Prototyping, Emerging Technologies, Business Transformation

Northeastern University
Skills you'll gain: Data Storytelling, Software Quality Assurance, Open Web Application Security Project (OWASP), Text Mining, Database Design, Agile Software Development, Software Development Life Cycle, Data Governance, Unsupervised Learning, Interactive Data Visualization, Software Architecture, Plotly, Cybersecurity, Classification Algorithms, PyTorch (Machine Learning Library), Statistical Hypothesis Testing, Java, Depreciation, Probability & Statistics, Cash Flows
 Status: NewStatus: Free Trial
Skills you'll gain: Scatter Plots, Data Visualization, Regression Analysis, Excel Formulas, Microsoft Excel, Data Analysis, Descriptive Statistics, Data Visualization Software, Analytics, Statistical Analysis, Statistical Methods, Descriptive Analytics, Correlation Analysis, Statistics, Analysis, Exploratory Data Analysis, Pivot Tables And Charts, Trend Analysis
 Status: Free Trial
Skills you'll gain: Plotly, Predictive Modeling, Exploratory Data Analysis, Data Storytelling, Statistical Machine Learning, Data Science, Business Analytics, Data-Driven Decision-Making, Pandas (Python Package), Data Analysis, Web Scraping, Data Wrangling, Model Evaluation, Python Programming, SQL, GitHub
Searches related to interactive visualization
In summary, here are 10 of our most popular interactive visualization courses
- Master Excel Skills: Analyze, Automate & Visualize Data: EDUCBA
- Anatomy: University of Michigan
- Excel Fundamentals for Data Analysis: Macquarie University
- Interprofessional Healthcare Informatics : University of Minnesota
- Creative Designing in Power BI : Microsoft
- Introduction to Business Analysis Using Spreadsheets: Basics: Coursera
- Data Analytics for Lean Six Sigma: University of Amsterdam
- Technical Writing for Software Developers: Packt
- 3D Printing and Additive Manufacturing: University of Illinois Urbana-Champaign
- Master of Science in Engineering Management: Northeastern University


