Results for "run chart"

The University of Edinburgh
Skills you'll gain: Cultural Diversity, Climate Change Programs, Cooperation, Interactive Learning, Creative Thinking, Creativity

Skills you'll gain: Root Cause Analysis, Data Ethics, Responsible AI, Retrieval-Augmented Generation, LLM Application, Operations Research, General Data Protection Regulation (GDPR), Regulatory Compliance, Strategic Decision-Making, Apache Kafka, Pareto Chart, Operational Analysis, Decision Intelligence, Stakeholder Communications, Revenue Management, Large Language Modeling, Real Time Data, Information Privacy, Statistical Inference, Reinforcement Learning

Skills you'll gain: Team Motivation, Team Management, Team Performance Management, Team Leadership, Team Building, Leadership and Management, Healthcare Project Management, Clinical Leadership, Decision Making, Strategic Leadership, Project Management, Leadership, Project Coordination, Resilience, Project Planning, Influencing, Project Closure, Communication, Life Sciences, Health Care
Skills you'll gain: Microsoft Excel, Pivot Tables And Charts, Spreadsheet Software, Data Visualization, Data Visualization Software, Excel Formulas, Dashboard, Case Studies, Data Analysis, Business Analytics, Data Presentation, Exploratory Data Analysis, Business, Analysis, Graphing
DeepLearning.AI
Skills you'll gain: Google Cloud Platform, Cloud Development, Model Training, Cloud Computing, Cloud Management, Applied Machine Learning, Machine Learning, Real Time Data
SkillsBooster Academy
Skills you'll gain: Business Leadership, Dashboard Creation, Marketing Automation, AI Enablement, Leadership, Strategic Leadership, Marketing Strategies, Strategic Marketing, AI Personalization, Decision Intelligence, Marketing Planning, Data-Driven Marketing, Business Strategy, Marketing Analytics, MarTech, Content Marketing, Media Planning, Prompt Engineering, Online Advertising, Digital Marketing

Northeastern University
Skills you'll gain: Project Closure, Engineering Management, Project Schedules, Engineering Software, Project Controls, Work Breakdown Structure, Project Management Life Cycle, Scheduling, Project Implementation, Earned Value Management, Project Management, Timelines, Project Performance, Project Planning, Project Design, Resource Planning, Workforce Planning, Resource Management, Program Evaluation, Forecasting

Skills you'll gain: Containerization, Kubernetes, Docker (Software), Cloud Deployment, Cloud-Native Computing, Google Cloud Platform, Cloud Applications, Cloud Computing, Application Deployment, Scalability, Public Cloud, Node.JS, Cloud Storage

Skills you'll gain: Docker (Software), Containerization, Kubernetes, Development Environment, Spring Boot, Application Deployment, DevOps, Microservices, Debugging, MongoDB, Software Installation, Restful API

Skills you'll gain: Cloud Development, Cloud Applications, Containerization, Cloud Deployment, Docker (Software), .NET Framework, Performance Tuning, Application Development, C# (Programming Language), Application Frameworks, Development Environment, Scalability, Web Applications

Skills you'll gain: Apache Maven, Eclipse (Software), Build Tools, Data Import/Export, Kotlin, Software Installation, Unit Testing, Database Management

Skills you'll gain: Strategic Sourcing, Supplier Management, Supplier Performance Management, Supplier Relationship Management, Procurement, Market Intelligence, Market Research, Data-Driven Decision-Making, Analysis, Decision Making
In summary, here are 10 of our most popular run chart courses
- Learning for Sustainable Futures: Live at COP30: The University of Edinburgh
- AI Techniques, Causal Inference & Business Optimization: Coursera
- Project Management & Leadership: Life Sciences & Healthcare: Creo Incubator
- Analyze & Visualize Data Using Advanced Excel: EDUCBA
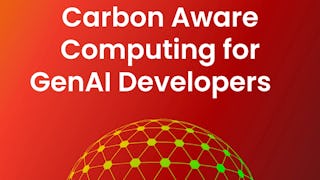
- Carbon Aware Computing for GenAI Developers: DeepLearning.AI
- DeepSeek R1 for AI Marketing and Business Strategy: SkillsBooster Academy
- Engineering Project Management Part 2: Northeastern University
- Running a Node.js Container on Google Kubernetes Engine: Google Cloud
- Containerize Spring Boot CRUD with Docker and Docker Compose: Packt
- .NET & .NET Core Mastery: Cross-Platform Development: Coursera


