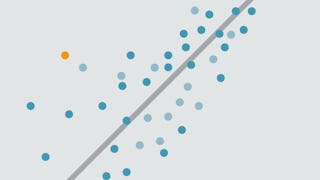
This course will introduce you to the linear regression model, which is a powerful tool that researchers can use to measure the relationship between multiple variables. We’ll begin by exploring the components of a bivariate regression model, which estimates the relationship between an independent and dependent variable. Building on this foundation, we’ll then discuss how to create and interpret a multivariate model, binary dependent variable model and interactive model. We’ll also consider how different types of variables, such as categorical and dummy variables, can be appropriately incorporated into a model. Overall, we’ll discuss some of the many different ways a regression model can be used for both descriptive and causal inference, as well as the limitations of this analytical tool. By the end of the course, you should be able to interpret and critically evaluate a multivariate regression analysis.

Gain next-level skills with Coursera Plus for $199 (regularly $399). Save now.

Quantifying Relationships with Regression Models
This course is part of Data Literacy Specialization

Instructor: Jennifer Bachner, PhD
3,104 already enrolled
Included with
(23 reviews)
Skills you'll gain
Details to know

Add to your LinkedIn profile
See how employees at top companies are mastering in-demand skills

Build your subject-matter expertise
- Learn new concepts from industry experts
- Gain a foundational understanding of a subject or tool
- Develop job-relevant skills with hands-on projects
- Earn a shareable career certificate

There are 4 modules in this course
While graphs are useful for visualizing relationships, they don't provide precise measures of the relationships between variables. Suppose you want to determine how an outcome of interest is expected to change if we change a related variable. We need more than just a scatter plot to answer this question. What should you do, for example, if you want to calculate whether air quality changes when vehicle emissions decline? Or if you want to calculate how consumer purchasing behavior changes if a new tax policy is implemented? To calculate these predicted effects, we can use a regression model. This module will first introduce correlation as an initial means of measuring the relationship between two variables. The module will then discuss prediction error as a framework for evaluating the accuracy of estimates. Finally, the module will introduce the linear regression model, which is a powerful tool we can use to develop precise measures of how variables are related to each other.
What's included
5 videos4 readings4 assignments
Now that you've got a handle on the basics of regression analysis, the next step is to consider how to evaluate and modify a basic regression model. This module will introduce you to a common measure of model fit and the three core assumptions of regression analysis. In addition, we'll explore the special circumstance of conducting a regression analysis with a binary (AKA dummy) treatment variable. Dummy variables, which take on two values, are frequently used in statistics. Understanding how to use and interpret dummy variables provides a foundation for developing a multivariate regression model, which we'll get to in the next module.
What's included
3 videos4 readings4 assignments
The bivariate regression model is an essential building block of statistics, but it is usually insufficient in practice as a useful model for descriptive, causal or predictive inference. This is because there are usually multiple variables that impact a particular dynamic. Whether you are modeling political behavior, environmental processes or drug treatment outcomes, it is almost always necessary to account for multiple influences on an outcome of interest. This module will introduce the multivariate model of regression analysis and explain the appropriate ways to interpret and evaluate the results from a multivariate analysis.
What's included
4 videos4 readings4 assignments
Once you've mastered the OLS multivariate model, you're ready to learn about a wide array of regression modeling techniques. Remember, researchers should always employ modeling tools that best enable them to answer the question at hand. This module will focus on two tools in particular, interaction terms and models for binary dependent variables. Keep in mind, however, that there are numerous regression modeling tools that you can learn and implement based on the research question you're trying to answer. After you've developed a solid understanding of regression basics, you should feel capable of expanding this knowledge base as you move forward as a producer and consumer of analytics.
What's included
5 videos2 readings2 assignments1 peer review
Earn a career certificate
Add this credential to your LinkedIn profile, resume, or CV. Share it on social media and in your performance review.
Instructor

Offered by
Explore more from Data Analysis
 Status: Free Trial
Duke University
 Status: Free Trial
 Status: Free Trial
Johns Hopkins University
Why people choose Coursera for their career


Learner reviews
23 reviews
- 5 stars
78.26%
- 4 stars
8.69%
- 3 stars
8.69%
- 2 stars
0%
- 1 star
4.34%
Showing 3 of 23
Reviewed on Jul 8, 2021
Great refresher on regression models. Simple and concise.

Open new doors with Coursera Plus
Unlimited access to 10,000+ world-class courses, hands-on projects, and job-ready certificate programs - all included in your subscription
Advance your career with an online degree
Earn a degree from world-class universities - 100% online
Join over 3,400 global companies that choose Coursera for Business
Upskill your employees to excel in the digital economy
Frequently asked questions
To access the course materials, assignments and to earn a Certificate, you will need to purchase the Certificate experience when you enroll in a course. You can try a Free Trial instead, or apply for Financial Aid. The course may offer 'Full Course, No Certificate' instead. This option lets you see all course materials, submit required assessments, and get a final grade. This also means that you will not be able to purchase a Certificate experience.
When you enroll in the course, you get access to all of the courses in the Specialization, and you earn a certificate when you complete the work. Your electronic Certificate will be added to your Accomplishments page - from there, you can print your Certificate or add it to your LinkedIn profile.
Yes. In select learning programs, you can apply for financial aid or a scholarship if you can’t afford the enrollment fee. If fin aid or scholarship is available for your learning program selection, you’ll find a link to apply on the description page.
More questions
Financial aid available,
¹ Some assignments in this course are AI-graded. For these assignments, your data will be used in accordance with Coursera's Privacy Notice.


